Single-Link Hierarchical Clustering Clearly Explained!
Introduction
As we all know, single-link Hierarchical clustering starts with treating each observation as an individual cluster, and then iteratively merges clusters until all the data points are merged into a single cluster. Dendrograms are used to represent hierarchical clustering results.
Clusters are merged based on the distance between them and to calculate the distance between the clusters we have different types of linkages.
This article was published as a part of the Data Science Blogathon
Table of contents
Linkage Criteria
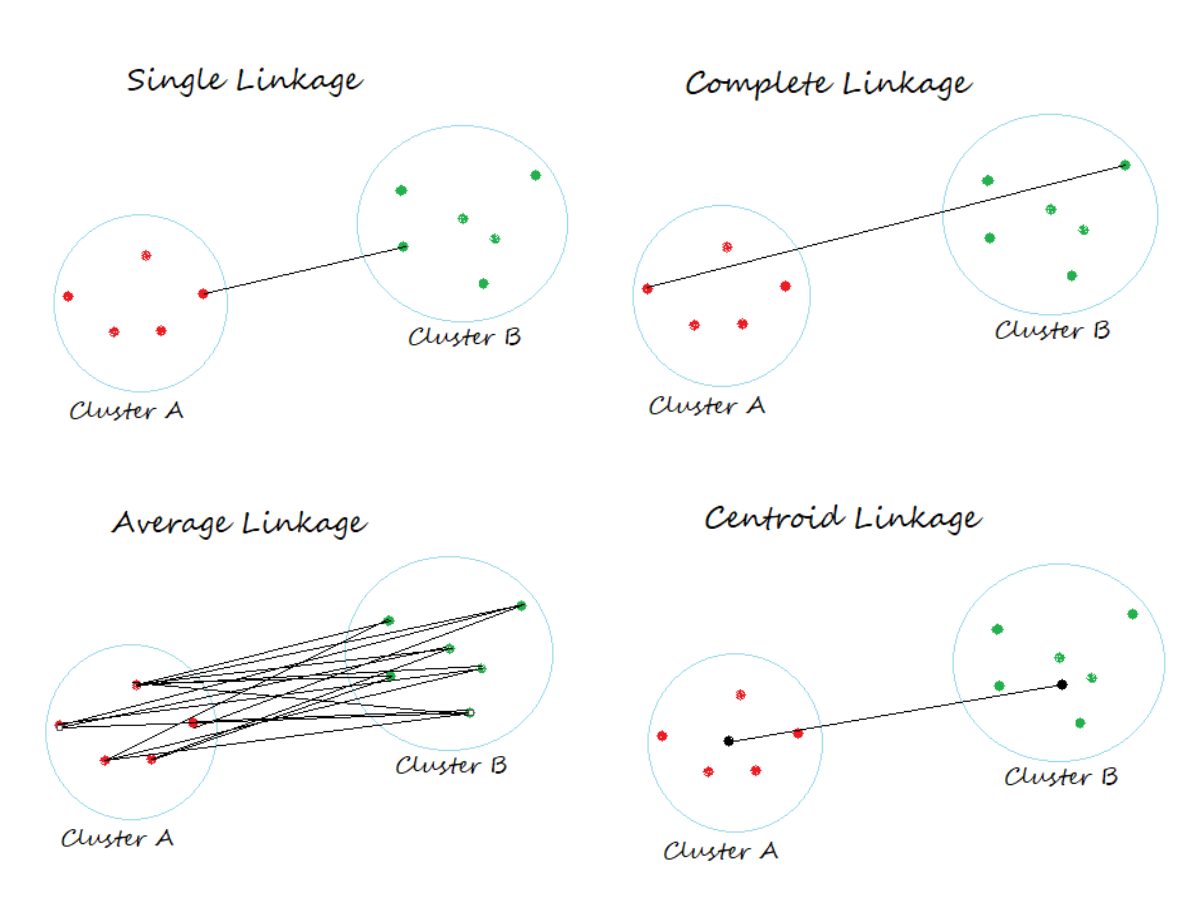
It determines the distance between sets of observations as a function of the pairwise distance between observations.
- In Single Linkage, the distance between two clusters is the minimum distance between members of the two clusters
- In Complete Linkage, the distance between two clusters is the maximum distance between members of the two clusters
- In Average Linkage, the distance between two clusters is the average of all distances between members of the two clusters
- In Centroid Linkage, the distance between two clusters is is the distance between their centroids
In this article, we aim to understand the Clustering process using the Single Linkage Method.
Clustering Using Single Linkage
Begin with importing necessary libraries
import numpy as np
import pandas as pd
import matplotlib.pyplot as plt
%matplotlib inline
import scipy.cluster.hierarchy as shc
from scipy.spatial.distance import squareform, pdist
Let us create toy data using numpy.random.random_sample
a = np.random.random_sample(size = 5)
b = np.random.random_sample(size = 5)
Once we generate the random data points, we will create a pandas data frame.
point = ['P1','P2','P3','P4','P5']
data = pd.DataFrame({'Point':point, 'a':np.round(a,2), 'b':np.round(b,2)})
data = data.set_index('Point')
data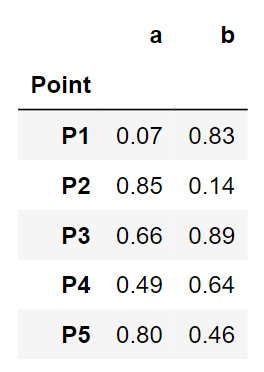
A glance at our toy data. Looks clean. Let us jump into the clustering steps.
Step1: Visualize the data using a Scatter Plot
plt.figure(figsize=(8,5))
plt.scatter(data['a'], data['b'], c='r', marker='*')
plt.xlabel('Column a')
plt.ylabel('column b')
plt.title('Scatter Plot of x and y')for j in data.itertuples():
    plt.annotate(j.Index, (j.a, j.b), fontsize=15)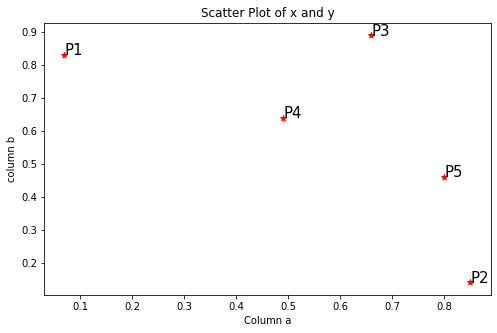
Step2: Calculating the distance matrix in Euclidean method using pdist
dist = pd.DataFrame(squareform(pdist(data[[‘a’, ‘b’]]), ‘euclidean’), columns=data.index.values, index=data.index.values)For our convenience, will be considering only the lower bound values of the matrix as shown below.
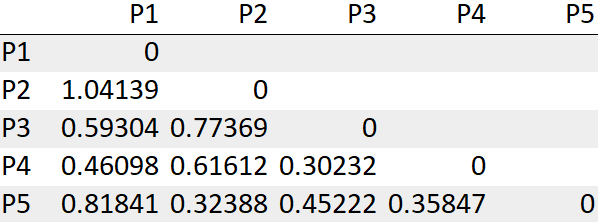
Step 3: Look for the least distance and merge those into a cluster
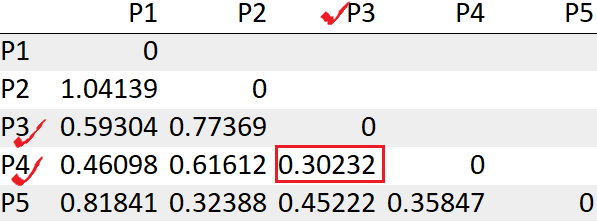
We see the points P3, P4 has the least distance “0.30232”. So we will first merge those into a cluster.
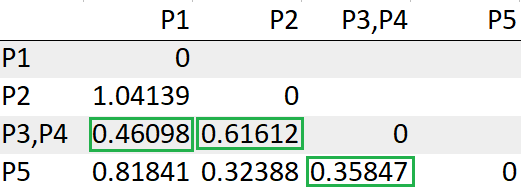
Step 4: Re-compute the distance matrix after forming a cluster
Update the distance between the cluster (P3,P4) to P1
= Min(dist(P3,P4), P1)) -> Min(dist(P3,P1),dist(P4,P1))
= Min(0.59304, 0.46098)
= 0.46098
Update the distance between the cluster (P3,P4) to P2
= Min(dist(P3,P4), P2) -> Min(dist(P3,P2),dist(P4,P2))
= Min(0.77369, 0.61612)
= 0.61612
Update the distance between the cluster (P3,P4) to P5
= Min(dist(P3,P4), P5) -> Min(dist(P3,P5),dist(P4,P5))
= Min(0.45222, 0.35847)
= 0.35847
Repeat steps 3,4 until we are left with one single cluster.
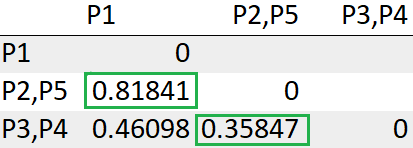
After re-computing the distance matrix, we need to again look for the least distance to make a cluster
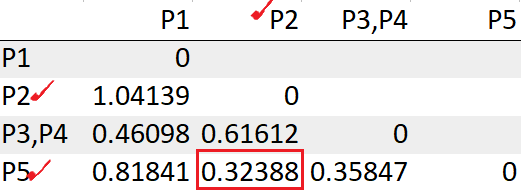
We see the points P2, P5 has the least distance “0.32388”. So we will group those into a cluster and recompute the distance matrix.
Update the distance between the cluster (P2,P5) to P1
= Min(dist((P2,P5),P1)) -> Min(dist(P2,P1), dist(P5, P1))
= Min(1.04139, 0.81841)
= 0.81841
Update the distance between the cluster (P2,P5) to (P3,P4)
= Min(dist((P2,P5), (P3,P4))) -> = Min(dist(P2,(P3,P4)), dist(P5,(P3,P4)))
= Min(dist(0.61612, 0.35847))
= 0.35847
After recomputing the distance matrix, we need to again look for the least distance.
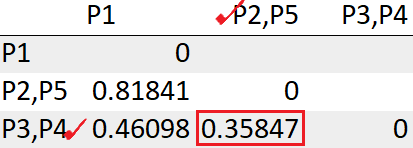
The cluster (P2,P5) has the least distance with the cluster (P3, P4) “0.35847”. So we will cluster them together.
Update the distance between the cluster (P3,P4, P2,P5) to P1
= Min(dist(((P3,P4),(P2,P5)), P1))
= Min(0.46098, 0.81841)
= 0.46098
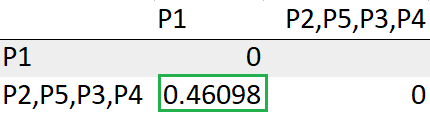
With this, we are done with obtaining a single cluster.
Theoretically, below are the clustering steps:
- P3, P4 points have the least distance and are merged
- P2, P5 points have the least distance and are merged
- The clusters (P3, P4), (P2, P5) are clustered
- The cluster (P3, P4, P2, P5) is merged with the datapoint P1
We can visualize the same using a dendrogram
plt.figure(figsize=(12,5))
plt.title("Dendrogram with Single inkage")
dend = shc.dendrogram(shc.linkage(data[['a', 'b']], method='single'), labels=data.index)
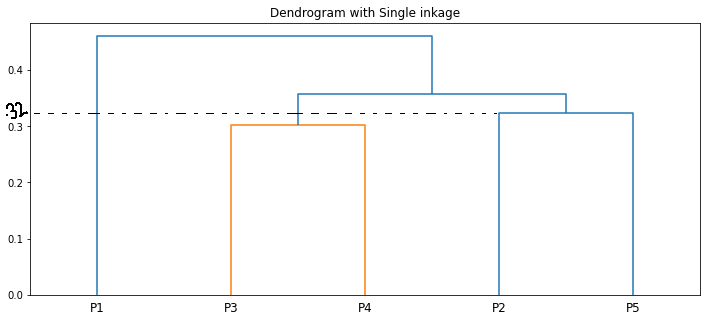
The length of the vertical lines in the dendrogram shows the distance. For example, the distance between the points P2, P5 is 0.32388.
The step-by-step clustering that we did is the same as the dendrogram🙌
Conclusion
Single linkage clustering involves visualizing data, calculating a distance matrix, and forming clusters based on the shortest distances. After each cluster formation, the distance matrix is updated to reflect new distances. This iterative process continues until all data points are clustered, revealing patterns in the data. It’s a simple, intuitive method that can uncover hidden structures in the data.
The media shown in this article are not owned by Analytics Vidhya and are used at the Author’s discretion.


