Introduction
Microsoft Excel and Google Sheets are two of the most basic and commonly used tools for data analysis. They offer various built-in functions that help in making statistical computations in every industry. One such function is the CONFIDENCE function. This formula calculates the confidence intervals for a sample dataset. In this article, we will explore what a confidence interval is along with its working examples. We will also give you instructions on how to calculate the confidence interval of a sample dataset in Excel and Google Sheets.
Overview
- Learn what a confidence interval is.
- Learn how to apply the CONFIDENCE function in Microsoft Excel and Google Sheets.
- Understand where all you can apply this function.
Enhance your knowledge with our Advanced Excel for Data Analysis course.
Table of Contents
What is the Confidence Function in Excel?
Confidence Function allows you to calculate a confidence interval for the mean of a dataset. A confidence interval is a range of values that is likely to contain the population mean with a certain level of confidence, typically 95% or 99%. In simple terms, this means that we are trying to find out a range of where the majority of outcomes or possibilities lie. In statistics, this tool is crucial for estimating the precision and reliability of an estimate derived from sample data.
Syntax of the Confidence Function
Both Excel and Google Sheets offer two primary functions for calculating confidence intervals:
- CONFIDENCE.NORM: We use this function in most cases, when the data follows a normal distribution. The syntax for this function is =CONFIDENCE.NORM(alpha, standard_dev, size)
- CONFIDENCE.T: When the data follows a t-distribution, we use this alternative instead. It typically applies for smaller sample sizes or when the population standard deviation is unknown. This function is written as =CONFIDENCE.T(alpha, standard_dev, size)
In this,
- alpha is the significance level (e.g., 0.05 for 95% confidence).
- standard_dev is the standard deviation of the sample.
- size is the sample size.
Check out this course to know more: Microsoft Excel: Formulas & Functions
How to Calculate Confidence Interval in Excel?
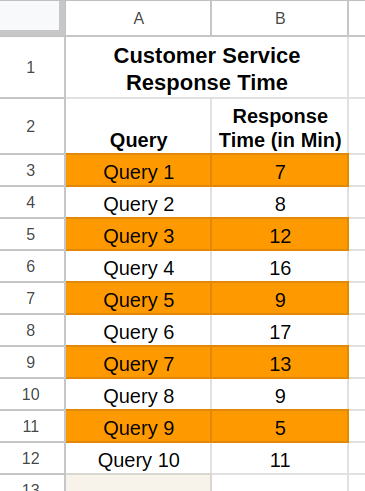
Now let’s take a real-life example to understand how to calculate the confidence interval in Microsoft Excel or Google Sheets. Suppose you are a data analyst at a customer service provider. You need to estimate the average response time of a customer support team. For this, let’s say, you have collected data from a sample of 10 inquiries and made a table as follows.
Now let’s see how to calculate the confidence interval of this data.
- Calculate the Sample Mean
First, calculate the sample mean of the data using the
AVERAGEfunction. In this case, we will type in=AVERAGE(B3:B12).
- Calculate the Standard Deviation
Next, use the
STDEV.Sfunction to calculate the standard deviation of the sample. In our example, it will be=STDEV.S(B3:B12).
- Determine the Alpha Value
Now, choose an alpha value corresponding to your desired confidence level. For a 95% confidence level, the alpha will be 0.05. Type this value into a new cell.

- Apply the Confidence Function
You can now calculate the confidence interval using
=CONFIDENCE(alpha, standard_dev, size). In our example, we will calculate it by typing in=CONFIDENCE(B14, B15, B16). Please note that the order of these values is important.
Alternatively, you can directly input the values as=CONFIDENCE(0.05, B15, 10)
- Calculate the Confidence Interval
The result from the previous step gives the margin of error. Add and subtract this value from the sample mean to get the confidence interval.
So, in our example, this will be calculated as:
Lower Limit:=B14 - B18
Upper Limit:=B14 + B18
This gives us a confidence interval of 6.61 to 11.39
Confidence Interval Calculation
Here’s the calculation done in this example.
- Sample size: 10
- Alpha: 0.05
Steps:
- Calculate mean:
=AVERAGE(B2:B12)-> 9 - Calculate standard deviation:
=STDEV.S(B3:B12)-> 3.86 - Confidence:
=CONFIDENCE(0.05, B15, 10)-> 2.392 - Confidence Interval:
Lower Limit: 9-2.392 -> 6.61
Upper Limit: 9+2.392 -> 11.39
Thus, with 95% confidence, the average response time of the customer support team lies between 6.61 and 11.39 minutes.
Common Errors and Tips
- #NUM! Error: This occurs if the standard deviation is zero or negative, the sample size is less than 2, or the alpha value is outside the range (0,1).
- #VALUE! Error: This occurs if any of the arguments are non-numeric. Ensure all inputs are numbers.
Real-Life Applications of Confidence Intervals
Confidence intervals are widely used in data analysis across various fields. Some common use cases include:
- Medical Research: To estimate the effectiveness of a new drug, we calculate the range within which the mean effect lies.
- Quality Control: To determine whether a batch of products meets the desired specifications, in manufacturing units.
- Market Research: To understand consumer preferences or satisfaction levels with a certain confidence level.
- Social Sciences: To study behaviors or opinions on certain topics within a certain population subset.
Conclusion
As you have seen in this article, calculating confidence intervals in Excel is a straightforward process. It is important for data analysts to know to use this function as it is an invaluable tool for statistical analysis. By following the steps outlined above, you can easily determine the confidence interval for any dataset, providing a clear range within which the true population parameter is likely to fall. This empowers you as a decision-maker, with the information needed to make informed choices based on data-driven insights.
For further learning, consider exploring this comprehensive Excel course to enhance your analytical skills.
Frequently Asked Questions
Q1. How does Excel calculate 95% confidence interval?
A. To calculate 95% confidence interval on Excel:
1. Calculate the mean of the dataset using: =AVERAGE(range)
2. Calculate the standard deviation of the dataset using: =STDEV.S(range)
3. Calculate the confidence value using: =CONFIDENCE(alpha, standard_dev, size), where alpha will be 0.05 for 95% confidence.
4. Calculate the confidence interval as Mean – Confidence to Mean + Confidence.
Q2. How to find 95% confidence interval?
A. Mathematically, a 95% confidence interval of a given dataset is calculated by adding and subtracting the confidence value from the mean of the dataset. The confidence value is calculated using the standard deviation of the dataset.
Q3. How to do a confidence interval on Google Sheets?
A. To do a confidence interval on Google Sheets:
1: Calculate the mean of the dataset using: =AVERAGE(range)
2: Calculate the standard deviation of the dataset using: =STDEV.S(range)
3: Calculate the confidence value using: =CONFIDENCE(alpha, standard_dev, size). The alpha value will be 0.05 for 95% confidence.
4: Calculate the confidence interval as Mean – Confidence to Mean + Confidence.
Q4. What is the confidence norm in Google Sheets?
A. CONFIDENCE NORM is a function in Google Sheets that calculates the confidence value of a dataset, where the data follows a normal distribution. The syntax for this function is =CONFIDENCE.NORM(alpha, standard_dev, size).
Sabreena is a GenAI enthusiast and tech editor who's passionate about documenting the latest advancements that shape the world. She's currently exploring the world of AI and Data Science as the Manager of Content & Growth at Analytics Vidhya.


