This article was published as a part of the Data Science Blogathon.
Introduction
This is the third article in the PySpark series, and in this article; we will be looking at PySpark’s GroupBy and Aggregate functions that could be very handy when it comes to segmenting out the data according to the requirements so that it would become a bit easier task to analyze the chunks of data separately based on the groups.
If you are already following my PySpark series, then it’s well and good; if not, then please refer to the links which I’m providing-
- Getting started with PySpark using Python
- Data Preprocessing using PySpark – PySpark’s DataFrame
- Data preprocessing using PySpark – Handling missing values
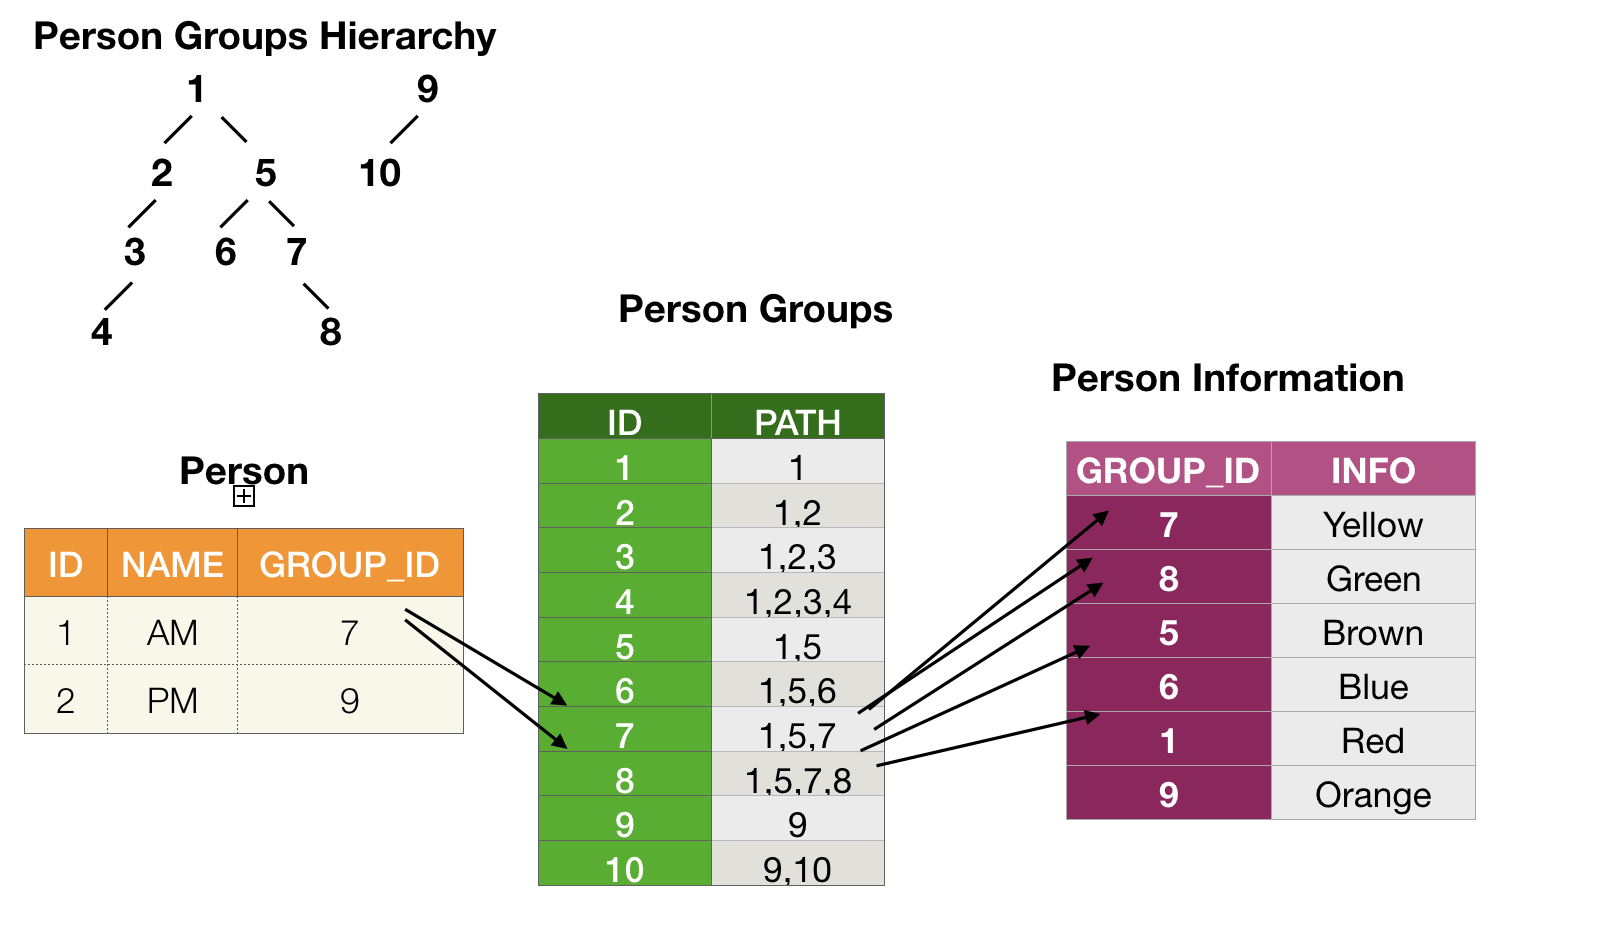
Image Source: Stack Overflow
Why do we Need GroupBy and Aggregate Functions?
Grouping out the data is one of the most essential and good to have skills whenever we are working with Big data because, especially when we are dealing with a considerable amount of the data during that time, if we are not able to segment that data, then it will be way harder to analyze it and use it further for drawing the business-related insights.
And when it comes to aggregate functions, it is the golden rule to remember that GroupBy and Aggregate functions go hand in hand, i.e., we can’t use the groupBy without an aggregate function like SUM, COUNT, AVG, MAX, MIN, and so on.
Before moving to the main topic of this particular article, let’s do the following mandatory steps.
- Starting the Spark Session
- Reading the dataset
Mandatory Steps
This section will get our PySpark connection with Apache Spark distribution. Then we will read our dataset on which we will be applying the aggregate and GroupBy operations.
Starting the Spark Session
Image Source: AmiraData
If you are following my PySpark series, it would be easier for you to understand that this is the starter template every time we want to get started with PySpark.
from pyspark.sql import SparkSession

spark_aggregate = SparkSession.builder.appName('Aggreagte and GroupBy').getOrCreate()
spark_aggregate
Output:
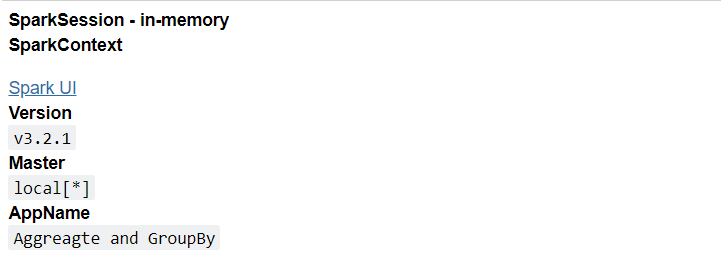
In a nutshell, what we have done is imported the SparkSession from the pyspark.sql package and created the SparkSession with the getOrCreate() function.
Reading the Dataset
Here we will be reading our dummy dataset on which we will be performing the GroupBy and Aggregate functions. I have chosen the dummy dataset to provide simplicity in understanding the concepts.
spark_aggregate_data = spark_aggregate.read.csv('/content/part4.csv', header = True, inferSchema = True)
spark_aggregate_data.show()
Output:
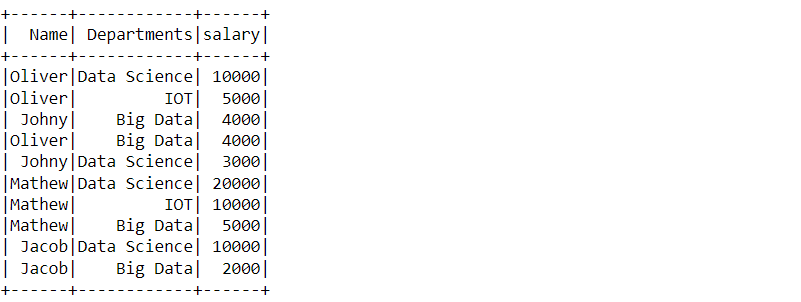
Here we have successfully read our dummy dataset and with the help of the show function, we can see the DataFrame.
Note: Starting a spark session and reading the dataset part I’ve already covered in my first article to this series is, Getting started with PySpark using python so if one is not able to grab each function related to the stuff mentioned above, then please visit that blog too where I’ve segregated each function.
Let’s check the schema of our table/dataset to see what kind of data each column holds.s.
spark_aggregate_data.printSchema()
Output:
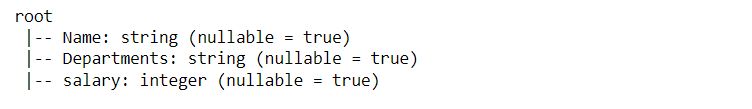
Inference: In the above output, we can see that after using printSchema() the function, we have the type of each column of our dataset.
- The name column holds the string data.
- The department’s column holds the string data.
- The salary column holds the integer data.
GroupBy Operations
Now let’s dive into the blog’s main topic, where we will start by performing a few GroupBy operations, which are very handy when we have to group the big data into smaller chunks and see how PySpark can do that.
spark_aggregate_data.groupBy('Name')
Output:
<pyspark.sql.group.GroupedData at 0x7f7d6927a9d0>
Inference: In the above code for grouping by the dataset, we have used the GroupBy() function, and here specifically, we are using the Name column to groupBy data and when we will see the output of the same so one can easily see that it GroupBy() function and here
Note: This is a pretty common thing, and the one who is familiar with the aggregate function of SQL knows that using the GroupBy function without an aggregate function is not possible, or we can say it doesn’t give the relevant output so along with SQL, this same strategy involves here as we will be using the groupBy function along with aggregate function.
Before using those aggregate function with our dataset corresponding to the group function, we will first see some common aggregate function and what operation it performs:
- AVG: This is the average aggregate function that returns the result set by grouping the column based on the average of a set of values.
- COUNT: This is the count aggregate function that returns the total number of sets of values in a column corresponding to the group function.
- MIN: This is the minimum aggregate function that returns the minimum or the smallest value among all the importance sets in the whole row.
- MAX: The working and approach of using the MAX function are the same as the MIN function. Only the main difference is that it will return the maximum value among the set of importance in the row.
- SUM: Now comes the SUM aggregate function, which will return the sum of all the numeric values corresponding to the grouped column.
So now, as we have discussed a few most commonly used aggregate functions, we will implement some of them and see what kind of results they will return.
GroupBy “Name” Column
In this sub-section, we will discuss the “Name” parameter of the GroupBy function and see how useful it could be in dealing with the summation method.
spark_aggregate_data.groupBy('Name').sum()
Output:
DataFrame[Name: string, sum(salary): bigint]
Inference: In the above code, along with the “GroupBy” function, we have used the sum aggregate function, and it has returned as the DataFrame which holds two columns.
- Name: This holds the string data as we already know that sum cannot be applied to the string; hence it will remain the same.
- Sum: If we look closely to find out that salary is grouped with the sum aggregate function, things will get more evident when we see the DataFrame that it had returned.
Let’s see what the above operation will return in the form of DataFrame
spark_aggregate_data.groupBy('Name').sum().show()
Output:
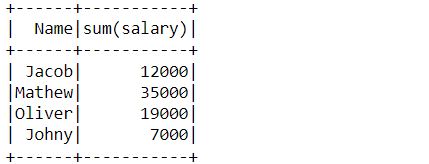
Inference: In the above output, it is clear that the Name column has been grouped along with the sum of the salary column.
Note: In short, we have answered one question: Who is earning the highest salary? Answer: It’s Jacob with 12000$ earning the highest among all.
Now let’s find out which department gives the maximum salary by using the groupBy function.
GroupBy “Department” Column
By grouping the Department column and using the sum aggregate function, we can find which department gives the maximum salary.
spark_aggregate_data.groupBy('Departments').sum().show()
Output:
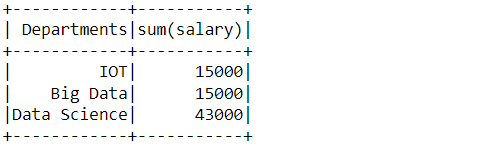
Inference: From the above output, it is visible that the Data Science department gives the maximum salary while IoT and Data science give equal salaries.
Now at the same time, if we want to see the mean of the salary, department-wise so, we will be grouping the department column but this time will use the mean aggregate function.
spark_aggregate_data.groupBy('Departments').mean().show()
Output:
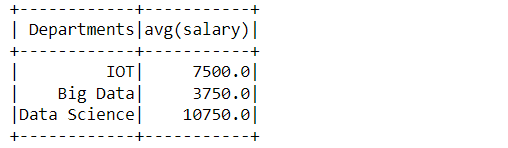
Inference: The above output shows the mean salary from each department that employees get.
Let’s find out another insight by using the groupBy function and another aggregate function.
This time we will find out the total number of employees in each department and for that, we will be using the count function and grouping the department column.
spark_aggregate_data.groupBy('Departments').count().show()
Output:
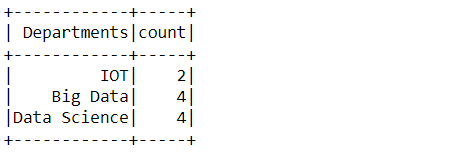
Inference: Here we can see that the highest number of employees is working in the Data Science and Big Data department, i.e., 4 while in the IoT department the total count is 2.
Similarly, we can use various aggregate functions depending on our requirements. Suppose we need to find out who is getting the maximum salary? so for that, we will GroupBy column and use the “max” aggregate function, and after that, we will get the desired result if the question is the opposite, so we will use the “min” function to find the minor salary of the employee.
Conclusion
This section will discuss what things we have covered so far. So, in the beginning, we saw the need for the Aggregation function and the GroupBy function. Then later in the section, we discussed those functions and their types and performed some tasks practically on the dataset, the same with the GroupBy task.
-
First, we performed the key tasks: setting up the spark session and reading the data on which we will be performing the operations.
- Then we head towards the main thing, i.e., GroupBy operations, and learned about how PySpark has implemented the same along with that, we deep-dived into the parameter part where we discussed,
- Name column
- Department column
- Along with groupBy operations, we also discussed aggregate function simultaneously because now we already know that both go hand in hand. Some of the tasks that we went through were,
- SUM()
- MEAN()
- COUNT()
Here’s the repo link to this article. I hope you liked my article on Data Preprocessing using PySpark -Aggregate and GroupBy functions. If you have any opinions or questions, then comment below.
Connect with me on LinkedIn for further discussion.
The media shown in this article is not owned by Analytics Vidhya and is used at the Author’s discretion.


