This article was published as a part of the Data Science Blogathon.
Introduction
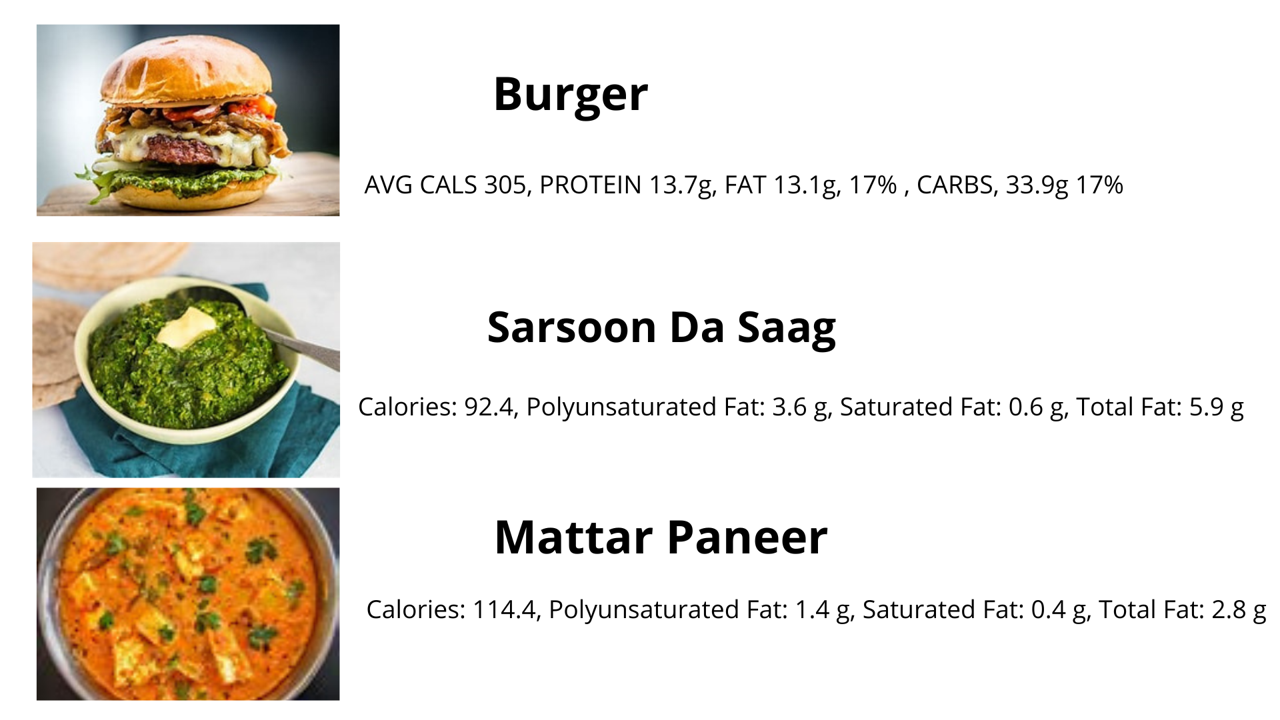
We all enjoy food, whether street food or in some restaurants of different varieties. Have you wondered which food to choose with how many calories or anything happens like surfing on the net, and suddenly you look at a food image and don’t know how many calories it has fat or protein content?
Nowadays, a consistent intake of healthful foods is required to maintain a balanced diet and avoid obesity in humans. Food intake is a component of health monitoring.
Diabetes and even cardiovascular illnesses can all get monitored with the help of this.
We will discuss later in detail about the cardiovascular disease. Let’s come to the point, being a Data Scientist, does the question come to your mind, how can we label or annotate images? If images are small in numbers, just labeling with the help of a simple method can be done, but if images are in large numbers?
We here introduce the library pigeon, which can help in the annotations of images, and after that, we can predict the labels of the images by building a model.
Purpose
We will discuss here in detail how to annotate and predict the images.
About the Dataset
This dataset contains photos of Indian food captured using mobile phones in a real-world context for the Indian food sector. It features a wide range of dish photos from all over India.
For detecting foods and health-related analytics, each image can have multiple labels.
Importing Relevant Libraries
Let’s start with importing different libraries we need to annotate and visualize our images.
You must all be familiar with NumPy # Numerical Python, Pandas, a data analysis and manipulation tool, and Matplotlib for visualization.
Glob module, as its name suggests it’s the shortest form of Global which means it searches all the file paths for the given pattern.
CV2 is another version of the CV which comes in handy for image processing.
OS, as you know, stands for the operating system and is Python standard library not required to download. It operates on the file system.
Pigeon, as mentioned, is used for annotation. It is a python library and can be installed by Github or by pip. PigeonXT is just an extension of Pigeon and helps us to annotate the unlabelled dataset.
pip install pigeonXT-jupyter
Python Imaging Library (PIL) modules provide an image library for editing.
From IPython.display module, we will import the display and image used for displaying data and images. Here is the dataset, which we’ll be using.
Code
import numpy as np
import pandas as pd
import matplotlib.pyplot as plt
import glob
import cv2
import os
import PIL.Image
from pigeonXT import annotate
from IPython.display import display, Image
To Visualize Different Images
We will import the Glob library and Image from PIL (Pillow Package). We created an empty list with variable images_lst. With the help of Glob library, we will open our folder with the name food image and append the so-called different pictures of food to our list.
Code
images_lst = [] #variable images_lst
for f in glob.glob(r"C:Usersss529Anaconda3foodimage*"): #the location of the image is mentioned. This has to be changed as per user's system, depending upon where the image is being saved.
    img=(PIL.Image.open(f))
    img = img.resize((200,200))#.reshape(len(img))
    #img.reshape(-1,1)
    images = np.asarray(img, dtype=np.int32)
    images_lst.append(images)
Now we will create a data frame with the name df5 and store it in csv file image_columns.csv.
Code
df5=pd.DataFrame([images_lst])
l=[]
for i in range(0, len(df5[0])):
    k=df5[0][i].astype(float)/255
l.append(k)
df5.shape
df5.to_csv('image_columns.csv')
To check the images from the data frame created.
im = df5.loc[0,1]
im
plt.imshow(im, cmap='gray')
plt.axis('off')
Annotation
We have different images stored in the folder, food images, and now we will use the Pigeon library to annotate the unlabeled dataset.
Code
annotations=annotate([  "C:\Users\ss529\Anaconda3\foodimageData1.jpg", "C:\Users\ss529\Anaconda3\foodimageData2.jpg",  "C:\Users\ss529\Anaconda3\foodimageData10.jpg" ],
  options=['Non-Veg', 'Pulses', 'Bread','Puri','Veg','dessert', 'Sweets','Rice','Chappati','Biscuits','Milk','Rasgulla','Snacks','Desi Ghee'],
  display_fn = lambda filename: display(Image(filename))
)
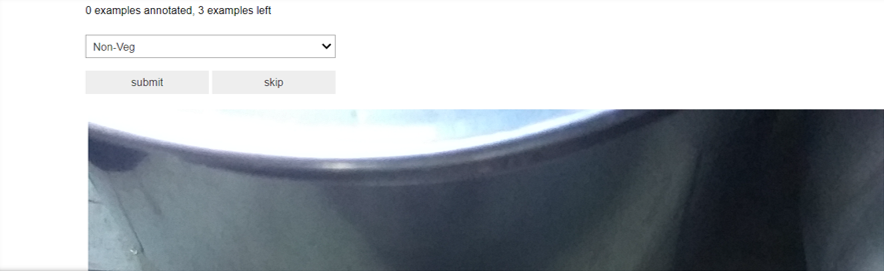
After labelling the data, it will show the data as shown below-
print(annotations)
[('C:\Users\ss529\Anaconda3\foodimage\Data1.jpg', 'Veg'),
 ('C:\Users\ss529\Anaconda3\foodimage\Data2.jpg', 'Pulses'),
 ('C:\Users\ss529\Anaconda3\foodimage\Data10.jpg', 'Veg')]
We can add another column, such as how much calorie food contains depending on need.
Extending the Annotations
To extend the annotation, we will use the extend keyword.
s=[]
s.extend(annotations)
[('C:\Users\ss529\Anaconda3\foodimage\Data1.jpg', 'Veg'),
 ('C:\Users\ss529\Anaconda3\foodimage\Data2.jpg', 'Pulses'),
 ('C:\Users\ss529\Anaconda3\foodimage\Data10.jpg', 'Veg')]
df=pd.DataFrame(s)
df.to_csv('food_items.csv')
df1=pd.read_csv("food_items.csv")
df1.head()
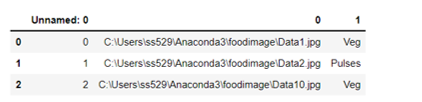
Renaming the columns
We will rename columns 0 as Url and column 1 as Labels.
df1.rename(columns={'1':'Labels','0': 'Url'}, inplace=True)
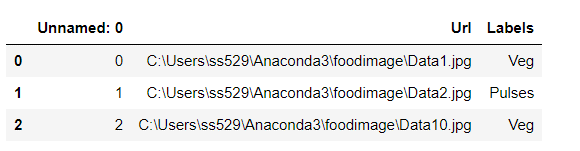
Removing the unwanted column
We will remove the unwanted column Unnamed:0, which is not required. We can use the pop method or del keyword to delete the column.
del df1['Unnamed: 0']
To check the shape.
df1['Labels'].shape
>>>(3,)
To check the images.
image= Image.open(df1['Url'][0])
plt.imshow(image, cmap='gray')
plt.axis('off')

After the annotation, we will place them into different folders for training, testing, and evaluation.
IMG_WIDTH=200
IMG_HEIGHT=200
batch_size=4
train_dir = r"C:Usersss529Anaconda3foodtraining"
test_dir = r"C:Usersss529Anaconda3foodvalidation"
eval_dir= r"C:Usersss529Anaconda3foodevaluation"
test_image= r"C:Usersss529Anaconda3foodtrainingBread100.jpg"
To check the images.
img=mpimg.imread(test_image)
plt.imshow(img)
.png)
We will create an empty set with different variables.
train = {}
test = {}
val_eval={}
We will create a path for test and training and holds in different variables.
path = r"C:Usersss529Anaconda3food"
path_train = os.path.join(path, "training")
We will open the list of directories for testing, training, and validation and store it in the different variables created.
for i in os.listdir(path_train):
    train[i] = os.listdir(os.path.join(path_train, i))
path_test = os.path.join(path, "validation")
for i in os.listdir(path_test):
    test[i] = os.listdir(os.path.join(path_test, i))
path_test = os.path.join(path, "evaluation")
for i in os.listdir(path_test):
    val_eval[i] = os.listdir(os.path.join(path_test, i))
We will check the shape of each piece of data collected.
from random import sample
There must be a question in your mind, why do we need a sample?
It’s a simple answer, as we need to check the length of items in each variable.
len_train = np.concatenate(list(train.values())).shape[0]
len_test = np.concatenate(list(test.values())).shape[0]
len_eval = np.concatenate(list(val_eval.values())).shape[0]
Print the result in format.
print("Images in training data : {}".format(len_train))
print("Images in testing data : {}".format(len_test))
print("Images in evaluation data : {}".format(len_eval))
>>>Images in training data : 176
>>>Images in testing data : 33
>>>Images in evaluation data : 72
To show the images in the Training set.
fig, axs = plt.subplots(len(train.keys()), 5, figsize = (15, 15))
for i, item in enumerate(os.listdir(path_train)):
    images = sample(train[item], 5)
    for j, image in enumerate(images):
        img = Image.open(os.path.join(path_train, item, image))
        axs[i, j].imshow(img)
        axs[i, j].set(xlabel = item, xticks = [], yticks = [])
fig.tight_layout()
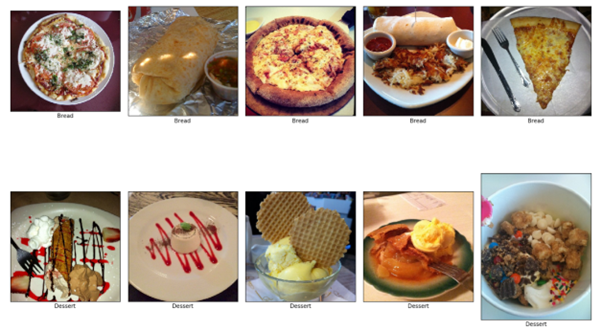
To check the length of different items of food images in the training set.
for item in train.keys():
    print(item, len(train[item]))
>>>Bread 115
   Dessert 11
   Vegetable 50
Building the Model
We will be using Keras Python deep learning library for building the model. We will be importing the Image Data Generator to enable the batch of images for training.
The sequential model enables layer-by-layer methods comprising each layer with input and output tensors.
from keras.preprocessing.image import ImageDataGenerator
from keras.models import Sequential
from keras.layers import Conv2D, MaxPooling2D
from keras.layers import Activation, Dropout, Flatten, Dense
Image width and height adjusted to 200.
model=tf.keras.Sequential(
        [
            tf.keras.layers.InputLayer(input_shape=(200,200,3)),
            tf.keras.layers.Conv2D(
                filters=32, kernel_size=2, strides=(2, 2), activation='relu'),
            tf.keras.layers.Conv2D(
                filters=64, kernel_size=2, strides=(2, 2), activation='relu'),
            tf.keras.layers.Flatten(),
            # No activation
            tf.keras.layers.Dense(6)])
epochs = 10
batch_size = 4
model.compile(optimizer='rmsprop', loss='sparse_categorical_crossentropy', metrics=['accuracy'])
epochs refer to the period.
batch_size here refers to the count of items.
train_datagen = ImageDataGenerator(
    rescale=1. / 255,
    horizontal_flip=True)
test_datagen = ImageDataGenerator(rescale=1. / 255)
# Train generator
train_generator = train_datagen.flow_from_directory(
    path_train,
    target_size=(200, 200),
    batch_size=4,
    class_mode='sparse'
)
validation_generator = test_datagen.flow_from_directory(
    test_dir,
    target_size=(img_width, img_height),
    batch_size=batch_size,
    class_mode='sparse')
# Test generator
test_generator = test_datagen.flow_from_directory(
    path_test,
    target_size=(200, 200),
    batch_size=4,
    class_mode='sparse'
)
class_mode refers to the type of labelled arrays.
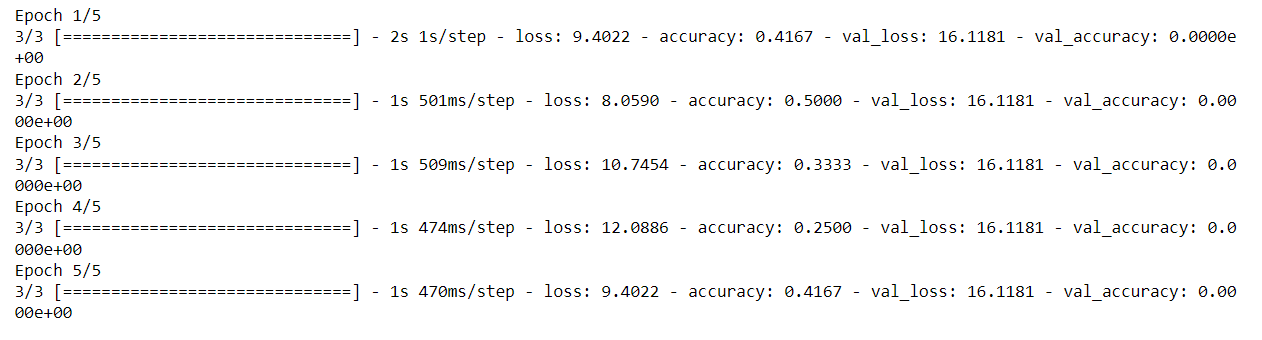
history = model.fit(train_generator, steps_per_epoch=len(train_generator)//batch_size, validation_data=test_generator, epochs=5)
Predictions
Some modules we will need to import for preprocessing the images.
from keras.preprocessing.image import img_to_array
from keras.applications.vgg16 import preprocess_input
from keras.applications.vgg16 import decode_predictions
from keras.applications.vgg16 import VGG16
from keras.models import load_model
from keras.preprocessing.image import load_img
We will create the empty list variable predictions.
prediction=[]
We will load the pictures from the training set and store them in a variable.
 image = load_img('food/training/Vegetable/10.jpg', target_size=(200, 200))
 img = np.array(image)
 img = img / 255.0
 img = img.reshape(1,200,200,3)
We will create a dictionary with keys and values assigned.
 labels = {
     0:'Bread',
     1:'Dessert',
     2:'Vegetable',
 }
We will use predict method from the model.
 label = model.predict(img)
 print(labels)
 label=label.argmax()
 prediction.append(labels[label])
 print("Predicted Class:", prediction)
 {0: 'Bread', 1: 'Dessert', 2: 'Vegetable'}
 Result
>>>Predicted Class: ['Vegetable']
Cardiovascular disease
Cardiovascular disease refers to a blockage of arteries. It is due to the deposition of fats in arteries, known as atherosclerosis. It blocks arteries, locking blood flows to muscles and causing a heart attack.
One of the most causes of death in the UK is cardiovascular disease. The Male and Females who died in 2015 and 2018 in Ireland show maximum deaths for those aged 70 plus.
Because of their use of alcohol, smoking, and poor eating habits, youths are more likely to develop CVD (cardiovascular disease).
Conclusion
Our two purposes were there one to annotate the unlabeled data and then build a model to predict the images. A correlation exists between overweight, diabetes, cancer, smoking, and CVD.
Reduced cigarette smoking, advances in hypertension treatment and control, and widespread use of statins to lower circulating cholesterol levels may contribute to a lower CVD risk in Europe, although the risk remains higher.
Additionally, keeping a food calorie label might be an intake for a healthy diet. To label and record the foods ingested frequently and an in-depth understanding of the foods consumed (due to the wide variety of cuisines). We have used library Pigeon to do annotations and Keras to build a model. Our results show the prediction of images correctly; however, the accuracy still needs to be improved.
Key Takeaways
1. How to use library Pigeon to annotate
2. How to Build a model for the prediction of images
3. Use of extension and del keyword.
The media shown in this article is not owned by Analytics Vidhya and is used at the Author’s discretion.
I have done my Master Of Science in Biotechnology and Master of Science in Bioinformatics from reputed Universities. I have written a few research papers, reviewed them, and am currently an Advisory Editorial Board Member at IJPBS.
I Look forward to the opportunities in IT to utilize my skills gained during work and Internship.
https://aster28.github.io/SoniaSinglaBio/site/


