Have you ever worked with a data analyst who never sleeps and needs no rest? Or one who can crunch numbers faster than you can say “pivot table”? If not, hold on to your seat because we are about to build just that! Today, we will be creating a data analyst AI agent for lightning-fast data analysis. Using OpenAI’s function calling, this AI automation can interpret your questions posed in plain English and give the desired outputs in seconds.
If everything is set up as we imagine it to be, you can ask the agent questions such as “What were our top ranking products last quarter for a particular department?” or “Show me the correlation between marketing spend and sales.” In return, you will get instant and accurate answers with nifty charts. This is what OpenAI function calling, combined with OpenAI data analysis capabilities, can do for you.
Table of contents
- What Makes This So Thrilling?
- The Architecture: How It All Works Together
- Setting Up Your Development Environment
- Core Functions: The Heart of Your AI Analyst
- The Magic of Function-Calling in Action
- Hands-On Project: Building Your Data Analyst AI Agent
- Advanced Techniques and Optimization
- Real World Applications and Use Cases
- Conclusion
What Makes This So Thrilling?
The problem that existed in the past with data thinking was that one had to know SQL. Higher-order thinking was needed to understand the complex nature of the data being analyzed. Or else, one had to spend several hours just going through various dashboards’ interfaces. Function Calling now allows us to create the AI agent to be a translational medium between human language and data instructions. Think of a translator who speaks fluently in `human’ and `database’!
The magic happens when the OpenAI language model chooses which function needs to be called upon based on your query in natural language. Ask about trends, and it would invoke a time-series analysis function. Request a comparison, and it will invoke a statistical comparison function. The AI is your associate who knows exactly the right tools for any question.
The Architecture: How It All Works Together
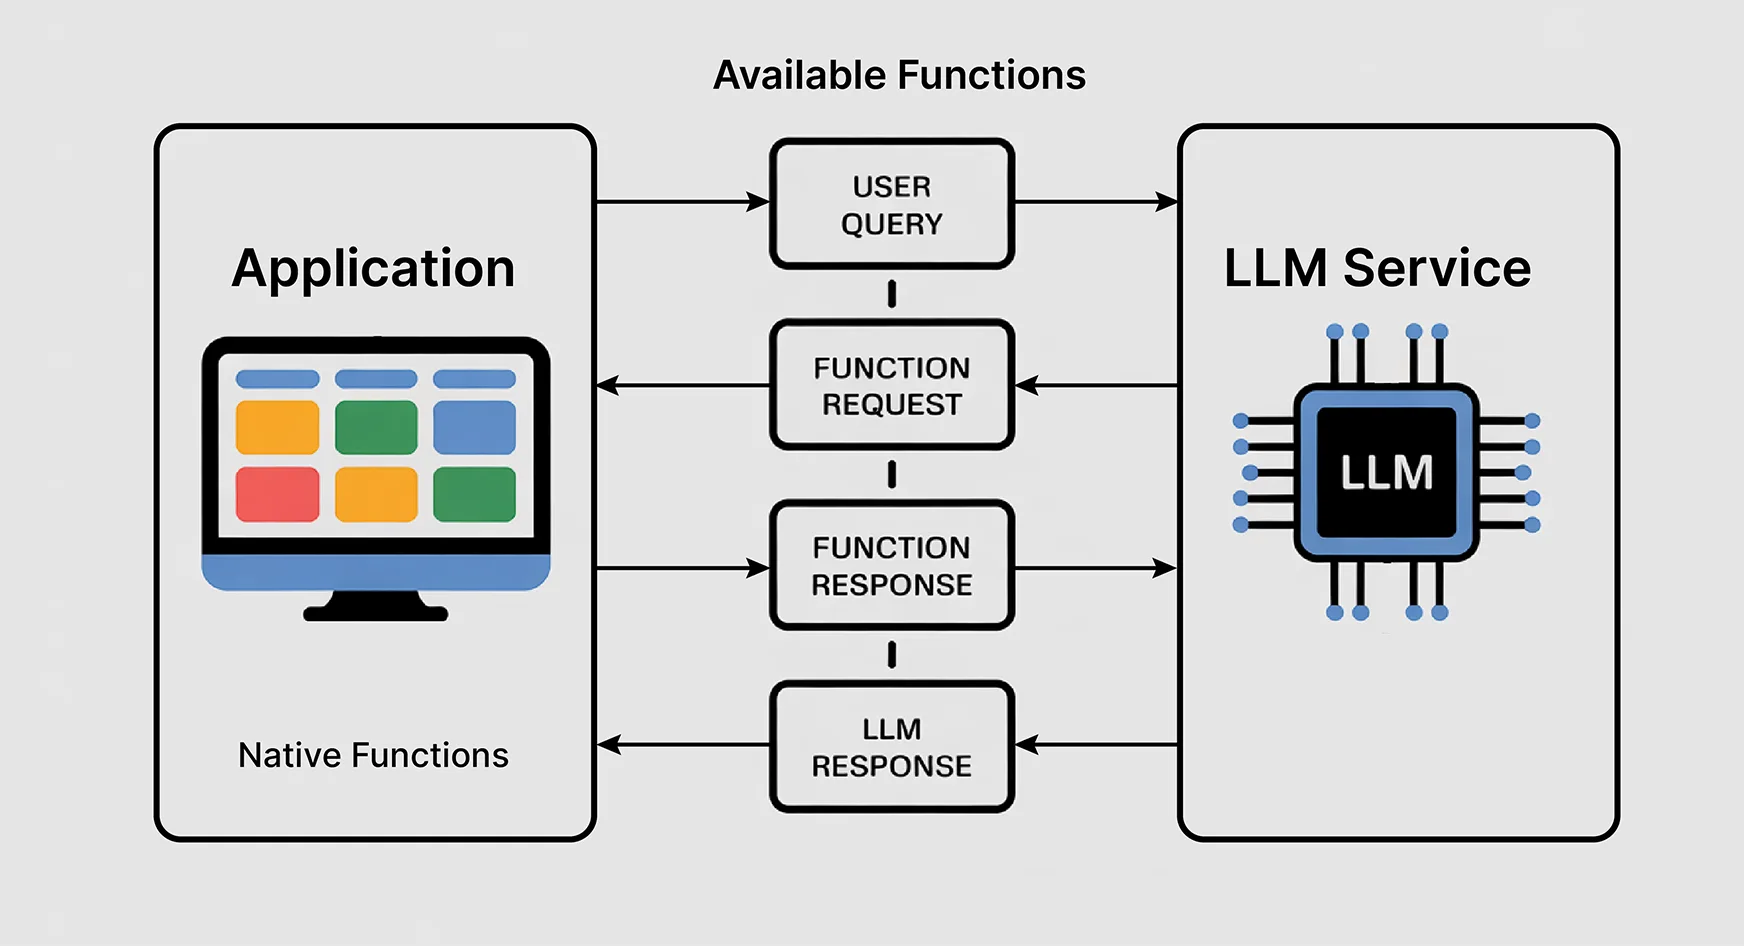
Our data analyst AI is an ensemble of main components working in sync with each other. Here are all the components that work in tandem:
- The Brain (OpenAI’s GPT Model): Processes natural-language queries and decides which functions to call. Think of it as an experienced data analyst who understands business questions and the technological implementation problems.
- The Toolbox (Function Library): We will establish an independent function for each distinct analysis, from statistics to graphics. Each is designed to carry through a given data operation in an efficient way.
- The Data Layer: This is responsible for loading, cleaning, and preparing all datasets. We will deal with numerous types of data and make sure our agent can handle all the messy data available out there.
- Communications Interface: This would ensure that the back-and-forth between the user, the AI model, and the function mission is effective and produces meaningful results.

The beauty of this architecture lies in its simplicity. Simply write a few new functions and register them with the AI. Need a new data source? Just plug in a new data connector. There could be infinite extensibility without a need for a human data analyst!
Setting Up Your Development Environment
Before anything else, we will need to set up a workspace for the AI-powered data science we seek. Here is how to do it.
- Necessary Dependencies: You will need OpenAI’s Python package for the API call. You will also need pandas for data handling (because come on, pandas is like the Swiss army knife of data science), matplotlib and seaborn for plotting, and numpy for number crunching.
- API Configuration: Get your API key from OpenAI. Along with it, we will add some error handling with rate limiting to ensure smooth working.
- Data Preparation Tools: Install libraries for CSV, JSON, Excel files, maybe even database connections, if you are feeling ambitious!
Core Functions: The Heart of Your AI Analyst
We want to develop the basic set of functions that will bestow upon our AI agent those very analytical powers:
- Loading and Inspection: Load data from various formats/sources and also present a first set of impressions about structure, data types, and basic statistics. Consider these as the AI’s getting-familiar phase with your data.
- Statistical Analysis: These functions offer mathematical interpretations of data from basic descriptive statistics to more complex correlation analyses. They are designed to yield results presented in formats appropriate for the AI interpretation and for the user component descriptions.
- Visualizations: These functions will produce charts, graphs, and plots as the AI determines the analysis. It is very important that they be flexible enough to handle various data types and still produce outputs readable by humans.
- Filtering and Data Transformation: Through these, the AI can cut, dice, and reshape data according to the user query.
The Magic of Function-Calling in Action
Here, things become really interesting. So, when you ask a question like: “What’s the trend in our monthly sales?”, the AI is not going to provide a generic answer. Instead, it will do the following:
- First, it analyzes the question to understand exactly what you want. It recognizes words such as “trend” and “monthly.” It then associates them with some suitable analytical methods.
- Based on that understanding, it decides which functions to call and in what order. It may decide to call the load-data function first and then apply time-based filtering, trend analysis, and finally create the visualizations.
- The AI proceeds to execute the functions in sequence. It intersperses them with some data passing. Each function provides structured output that the AI processes and builds on.
- To summarise, the AI combines all the outputs from multiple analysis stages into one coherent explanation. It then returns this to the end-user with insights, visualization, and recommendations for action.
Hands-On Project: Building Your Data Analyst AI Agent
Let us go a step further and build a complete data analyst AI agent, one that actually deals with real business data and gives actionable insights. For this, we will design an AI agent to analyze e-commerce sales data. The agent will be capable of answering questions about product performance, customer behavior, seasonal trends, and areas to improve revenue.
1. Install Required Packages
!pip install openai pandas matplotlib seaborn numpy plotly2. Import Libraries and Setup
import openai
import pandas as pd
import numpy as np
import matplotlib.pyplot as plt
import seaborn as sns
import plotly.express as px
import plotly.graph_objects as go
from datetime import datetime, timedelta
import json
import warnings
warnings.filterwarnings('ignore')

# Set your OpenAI API key here
openai.api_key = "your-openai-api-key-here"  # Replace with your actual API key

print("✅ All libraries imported successfully!")
3. Generate Sample E-Commerce Data
def generate_sample_data():
"""Generate realistic e-commerce sales data for demonstration"""
np.random.seed(42)
# Product categories and names
categories = ['Electronics', 'Clothing', 'Books', 'Home & Garden', 'Sports']
products = {
'Electronics': ['Smartphone', 'Laptop', 'Headphones', 'Tablet', 'Smart Watch'],
'Clothing': ['T-Shirt', 'Jeans', 'Sneakers', 'Jacket', 'Dress'],
'Books': ['Fiction Novel', 'Science Book', 'Cookbook', 'Biography', 'Self-Help'],
'Home & Garden': ['Coffee Maker', 'Plant Pot', 'Lamp', 'Pillow', 'Rug'],
'Sports': ['Running Shoes', 'Yoga Mat', 'Dumbbell', 'Basketball', 'Tennis Racket']
}
# Generate data for the last 12 months
start_date = datetime.now() - timedelta(days=365)
dates = pd.date_range(start=start_date, end=datetime.now(), freq='D')
data = []
customer_id = 1000
for date in dates:
# Simulate seasonal patterns
month = date.month
seasonal_multiplier = 1.2 if month in [11, 12] else (1.1 if month in [6, 7] else 1.0)
# Generate 10-50 orders per day
daily_orders = np.random.poisson(25 * seasonal_multiplier)
for _ in range(daily_orders):
category = np.random.choice(categories, p=[0.3, 0.25, 0.15, 0.15, 0.15])
product = np.random.choice(products[category])
# Price based on category
price_ranges = {
'Electronics': (50, 1000),
'Clothing': (15, 200),
'Books': (10, 50),
'Home & Garden': (20, 300),
'Sports': (25, 250)
}
price = np.random.uniform(*price_ranges[category])
quantity = np.random.choice([1, 2, 3], p=[0.7, 0.2, 0.1])
data.append({
'date': date,
'customer_id': customer_id,
'product_name': product,
'category': category,
'quantity': quantity,
'unit_price': round(price, 2),
'total_amount': round(price * quantity, 2)
})
customer_id += 1
return pd.DataFrame(data)
# Generate and display sample data
df = generate_sample_data()
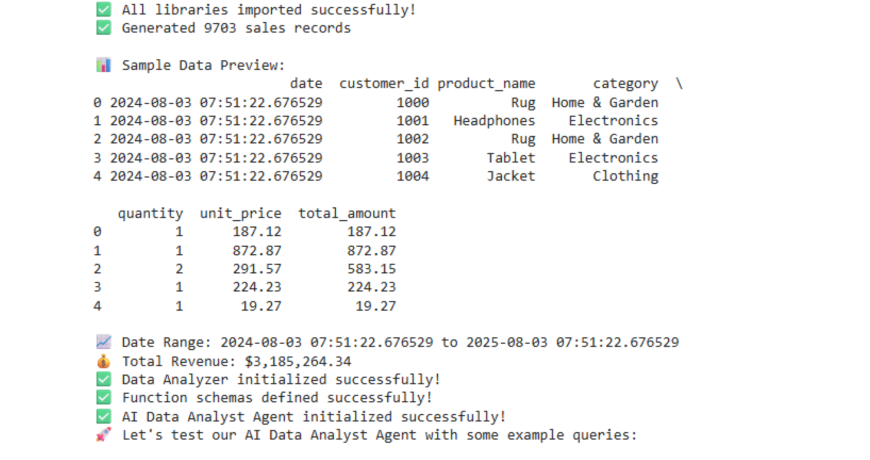
print(f"✅ Generated {len(df)} sales records")
print("\n📊 Sample Data Preview:")
print(df.head())
print(f"\n📈 Date Range: {df['date'].min()} to {df['date'].max()}")
print(f"💰 Total Revenue: ${df['total_amount'].sum():,.2f}")4. Define Analysis Functions
class DataAnalyzer:
    def __init__(self, dataframe):
        self.df = dataframe.copy()
        self.df['date'] = pd.to_datetime(self.df['date'])

    def get_revenue_summary(self, period='monthly'):
        """Calculate revenue summary by time period"""
        try:
            if period == 'daily':
                grouped = self.df.groupby(self.df['date'].dt.date)
            elif period == 'weekly':
                grouped = self.df.groupby(self.df['date'].dt.isocalendar().week)
            elif period == 'monthly':
                grouped = self.df.groupby(self.df['date'].dt.to_period('M'))
            else:
                return {"error": "Invalid period. Use 'daily', 'weekly', or 'monthly'"}

            revenue_data = grouped['total_amount'].sum().reset_index()
            revenue_data.columns = ['period', 'revenue']

            return {
                "success": True,
                "data": revenue_data.to_dict('records'),
                "total_revenue": float(self.df['total_amount'].sum()),
                "average_revenue": float(revenue_data['revenue'].mean()),
                "period": period
            }
        except Exception as e:
            return {"error": str(e)}

    def get_top_products(self, limit=10, metric='revenue'):
        """Get top performing products"""
        try:
            if metric == 'revenue':
                top_products = self.df.groupby('product_name')['total_amount'].sum().sort_values(ascending=False).head(limit)
            elif metric == 'quantity':
                top_products = self.df.groupby('product_name')['quantity'].sum().sort_values(ascending=False).head(limit)
            else:
                return {"error": "Invalid metric. Use 'revenue' or 'quantity'"}

            return {
                "success": True,
                "data": [{"product": prod, "value": float(val)} for prod, val in top_products.items()],
                "metric": metric,
                "limit": limit
            }
        except Exception as e:
            return {"error": str(e)}

    def get_category_performance(self):
        """Analyze performance by product category"""
        try:
            category_stats = self.df.groupby('category').agg({
                'total_amount': ['sum', 'mean'],
                'quantity': 'sum',
                'customer_id': 'nunique'
            }).round(2)

            category_stats.columns = ['total_revenue', 'avg_order_value', 'total_quantity', 'unique_customers']
            category_stats = category_stats.reset_index()

            return {
                "success": True,
                "data": category_stats.to_dict('records')
            }
        except Exception as e:
            return {"error": str(e)}

    def get_customer_insights(self):
        """Analyze customer behavior patterns"""
        try:
            customer_stats = self.df.groupby('customer_id').agg({
                'total_amount': 'sum',
                'date': ['min', 'max', 'nunique']
            }).round(2)

            customer_stats.columns = ['total_spent', 'first_purchase', 'last_purchase', 'purchase_frequency']

            insights = {
                "total_customers": len(customer_stats),
                "avg_customer_value": float(customer_stats['total_spent'].mean()),
                "avg_purchase_frequency": float(customer_stats['purchase_frequency'].mean()),
                "top_spenders": customer_stats.nlargest(5, 'total_spent')['total_spent'].to_dict()
            }

            return {"success": True, "data": insights}
        except Exception as e:
            return {"error": str(e)}

    def create_visualization(self, chart_type, data_params):
        """Create various types of visualizations"""
        try:
            plt.figure(figsize=(12, 6))

            if chart_type == 'revenue_trend':
                # Monthly revenue trend
                monthly_data = self.df.groupby(self.df['date'].dt.to_period('M'))['total_amount'].sum()
                plt.plot(range(len(monthly_data)), monthly_data.values, marker='o', linewidth=2)
                plt.title('Monthly Revenue Trend', fontsize=16, fontweight='bold')
                plt.xlabel('Month')
                plt.ylabel('Revenue ($)')
                plt.xticks(range(len(monthly_data)), [str(x) for x in monthly_data.index], rotation=45)
                plt.grid(True, alpha=0.3)

            elif chart_type == 'category_pie':
                # Category revenue distribution
                category_revenue = self.df.groupby('category')['total_amount'].sum()
                plt.pie(category_revenue.values, labels=category_revenue.index, autopct='%1.1f%%', startangle=90)
                plt.title('Revenue Distribution by Category', fontsize=16, fontweight='bold')

            elif chart_type == 'top_products_bar':
                # Top products bar chart
                top_products = self.df.groupby('product_name')['total_amount'].sum().sort_values(ascending=False).head(10)
                plt.barh(range(len(top_products)), top_products.values)
                plt.yticks(range(len(top_products)), top_products.index)
                plt.title('Top 10 Products by Revenue', fontsize=16, fontweight='bold')
                plt.xlabel('Revenue ($)')

            plt.tight_layout()
            plt.show()

            return {"success": True, "message": f"Created {chart_type} visualization"}

        except Exception as e:
            return {"error": str(e)}

# Initialize analyzer
analyzer = DataAnalyzer(df)
print("✅ Data Analyzer initialized successfully!")
5. Function Definitions for OpenAI
def get_revenue_summary(period='monthly'):
    """Get revenue summary by time period (daily, weekly, monthly)"""
    return analyzer.get_revenue_summary(period)

def get_top_products(limit=10, metric='revenue'):
    """Get top performing products by revenue or quantity"""
    return analyzer.get_top_products(limit, metric)

def get_category_performance():
    """Analyze performance metrics by product category"""
    return analyzer.get_category_performance()

def get_customer_insights():
    """Get insights about customer behavior and patterns"""
    return analyzer.get_customer_insights()

def create_visualization(chart_type, data_params=None):
    """Create visualizations (revenue_trend, category_pie, top_products_bar)"""
    return analyzer.create_visualization(chart_type, data_params or {})

def get_basic_stats():
    """Get basic statistics about the dataset"""
    return {
        "success": True,
        "data": {
            "total_records": len(analyzer.df),
            "date_range": {
                "start": str(analyzer.df['date'].min().date()),
                "end": str(analyzer.df['date'].max().date())
            },
            "total_revenue": float(analyzer.df['total_amount'].sum()),
            "unique_products": analyzer.df['product_name'].nunique(),
            "unique_customers": analyzer.df['customer_id'].nunique(),
            "categories": analyzer.df['category'].unique().tolist()
        }
    }
6. OpenAI Function Schemas
functions = [
    {
        "name": "get_revenue_summary",
        "description": "Get revenue summary grouped by time period",
        "parameters": {
            "type": "object",
            "properties": {
                "period": {
                    "type": "string",
                    "enum": ["daily", "weekly", "monthly"],
                    "description": "Time period for grouping revenue data"
                }
            },
            "required": ["period"]
        }
    },
    {
        "name": "get_top_products",
        "description": "Get top performing products by revenue or quantity",
        "parameters": {
            "type": "object",
            "properties": {
                "limit": {
                    "type": "integer",
                    "description": "Number of top products to return (default: 10)"
                },
                "metric": {
                    "type": "string",
                    "enum": ["revenue", "quantity"],
                    "description": "Metric to rank products by"
                }
            },
            "required": ["metric"]
        }
    },
    {
        "name": "get_category_performance",
        "description": "Analyze performance metrics by product category including revenue, quantity, and customers",
        "parameters": {
            "type": "object",
            "properties": {}
        }
    },
    {
        "name": "get_customer_insights",
        "description": "Get insights about customer behavior, spending patterns, and purchase frequency",
        "parameters": {
            "type": "object",
            "properties": {}
        }
    },
    {
        "name": "create_visualization",
        "description": "Create data visualizations like charts and graphs",
        "parameters": {
            "type": "object",
            "properties": {
                "chart_type": {
                    "type": "string",
                    "enum": ["revenue_trend", "category_pie", "top_products_bar"],
                    "description": "Type of chart to create"
                },
                "data_params": {
                    "type": "object",
                    "description": "Additional parameters for the chart"
                }
            },
            "required": ["chart_type"]
        }
    },
    {
        "name": "get_basic_stats",
        "description": "Get basic statistics and overview of the dataset",
        "parameters": {
            "type": "object",
            "properties": {}
        }
    }
]

print("✅ Function schemas defined successfully!")
7. Main AI Agent Class
class DataAnalystAI:
    def __init__(self, api_key):
        self.client = openai.OpenAI(api_key=api_key)
        self.functions = {
            "get_revenue_summary": get_revenue_summary,
            "get_top_products": get_top_products,
            "get_category_performance": get_category_performance,
            "get_customer_insights": get_customer_insights,
            "create_visualization": create_visualization,
            "get_basic_stats": get_basic_stats
        }
        self.conversation_history = []

    def process_query(self, user_query):
        """Process user query and return AI response with function calls"""
        try:
            # Add user message to conversation
            messages = [
                {
                    "role": "system",
                    "content": """You are a helpful data analyst AI assistant. You can analyze e-commerce sales data and create visualizations.
                    Always provide clear, actionable insights. When showing numerical data, format it nicely with commas for large numbers.
                    If you create visualizations, mention that the chart has been displayed.
                    Be conversational and explain your findings in business terms."""
                },
                {"role": "user", "content": user_query}
            ]

            # Add conversation history
            messages = messages[:-1] + self.conversation_history + messages[-1:]

            # Call OpenAI API with function calling
            response = self.client.chat.completions.create(
                model="gpt-3.5-turbo",
                messages=messages,
                functions=functions,
                function_call="auto",
                temperature=0.7
            )

            message = response.choices[0].message

            # Handle function calls
            if message.function_call:
                function_name = message.function_call.name
                function_args = json.loads(message.function_call.arguments)

                print(f"🔧 Calling function: {function_name} with args: {function_args}")

                # Execute the function
                function_result = self.functions[function_name](**function_args)

                # Get AI's interpretation of the results
                messages.append({
                    "role": "assistant",
                    "content": None,
                    "function_call": {
                        "name": function_name,
                        "arguments": message.function_call.arguments
                    }
                })

                messages.append({
                    "role": "function",
                    "name": function_name,
                    "content": json.dumps(function_result)
                })

                # Get final response from AI
                final_response = self.client.chat.completions.create(
                    model="gpt-3.5-turbo",
                    messages=messages,
                    temperature=0.7
                )

                ai_response = final_response.choices[0].message.content

                # Update conversation history
                self.conversation_history.append({"role": "user", "content": user_query})
                self.conversation_history.append({"role": "assistant", "content": ai_response})

                return ai_response

            else:
                # No function call needed
                ai_response = message.content
                self.conversation_history.append({"role": "user", "content": user_query})
                self.conversation_history.append({"role": "assistant", "content": ai_response})
                return ai_response

        except Exception as e:
            return f"❌ Error processing query: {str(e)}"

# Initialize the AI agent
ai_agent = DataAnalystAI("your-openai-api-key-here")  # Replace with your API key
print("✅ AI Data Analyst Agent initialized successfully!")
8. Interactive Query Interface
def ask_ai(query):
"""Simple interface to ask questions to the AI agent"""
print(f"🙋 Question: {query}")
print("🤖 AI Response:")
response = ai_agent.process_query(query)
print(response)
print("\n" + "="*80 + "\n")
return response
# Cell 9: Example Queries - Run these to test your agent!
print("🚀 Let's test our AI Data Analyst Agent with some example queries:\n")
# Test basic stats
ask_ai("Give me an overview of our sales data")
# Test revenue analysis
ask_ai("Show me the monthly revenue trend")
# Test product analysis
ask_ai("What are our top 5 products by revenue?")
# Test category performance
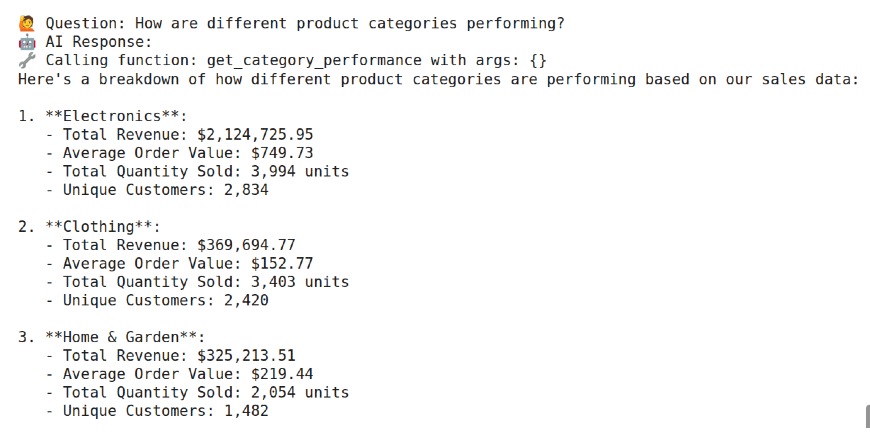
ask_ai("How are different product categories performing?")
# Test customer insights
ask_ai("Tell me about our customer behavior patterns")
# Test visualization
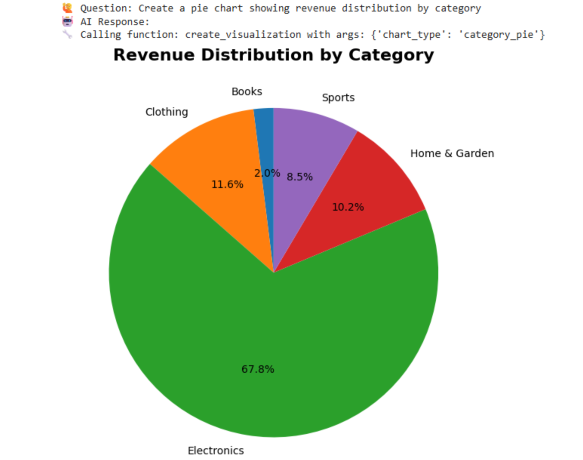
ask_ai("Create a pie chart showing revenue distribution by category")
# Test comparative analysis
ask_ai("Which product category generates the highest average order value?")
print("🎉 All tests completed! Your AI Data Analyst Agent is ready to use!")Output
Advanced Techniques and Optimization
With the basic agent in place, there would be several enhancements over time:
- Function Chaining: These are multi-step analysis steps chained together and assisted by AI. Many multi-step analytical workflows would otherwise require manual coordination.
- Context Awareness: Implement some context management for the agent so that it tracks what analyses have already been done and builds upon that. This allows conversations rather similar to appealing to a phone call.
- Performance Optimization: Cache costly calculations, parallelize any analyses that can be done independently. It generally makes the function implementations quicker and less memory-intensive.
- Error Handling: Incorporate thorough error catching to gracefully handle issues. Especially useful in the event of data issues, API failures, or just unexpected user inputs. Also helps provide the user with reasonable feedback.
Real World Applications and Use Cases
The possibilities for your data analyst AI agent are virtually endless:
- Business Intelligence: Provide regular reports, enable self-service analytics for the average person, and provide instant insights to decision-makers.
- Marketing Analytics: Review campaign performance metrics, customer segmentations, and ROI calculations with natural language queries.
- Financial Analysis: Monitor KPIs and variances and file financial reports with plain language questions.
- Operations Optimization: Monitor performance data and bottlenecks and optimize processes based on data-driven insights.
Conclusion
Building a data analyst AI agent is more than just a technical exercise – it is about democratizing data analysis and offering insights to all. You have built a tool that might help change the interaction between people and data, removing barriers so decisions can be made based on data. The techniques you have learned provide the foundation for many other AI applications.
Function calling is a versatile idea and can be useful for everything from customer service automation to intricate workflow orchestrations. Remember, the best AIs do not replace human intellect: they supplement it. The data analyst AI you have should encourage users to ask better questions about their data, inspire them to dig deeper and analyze their data better, and help them make better decisions. Therefore, it is not about having all the answers; it is about having some of the answers to find all the others.
Gen AI Intern at Analytics Vidhya
Department of Computer Science, Vellore Institute of Technology, Vellore, India
I am currently working as a Gen AI Intern at Analytics Vidhya, where I contribute to innovative AI-driven solutions that empower businesses to leverage data effectively. As a final-year Computer Science student at Vellore Institute of Technology, I bring a solid foundation in software development, data analytics, and machine learning to my role.
Feel free to connect with me at [email protected]


