The role of a Data Analyst in 2026 looks very different from even a few years ago. Today’s analysts are expected to work with messy data, automate reporting, explain insights clearly to business stakeholders, and responsibly use AI to accelerate their workflow. This Data Analyst learning path for 2026 is designed as a practical, month-by-month roadmap that mirrors real industry expectations rather than academic theory. It focuses on building strong foundations, developing analytical depth, mastering storytelling, and preparing you for hiring and on-the-job success. By following this roadmap, you will not only learn tools like Excel, SQL, Python, and BI platforms, but also understand how to apply them to real business problems with confidence.
Table of contents
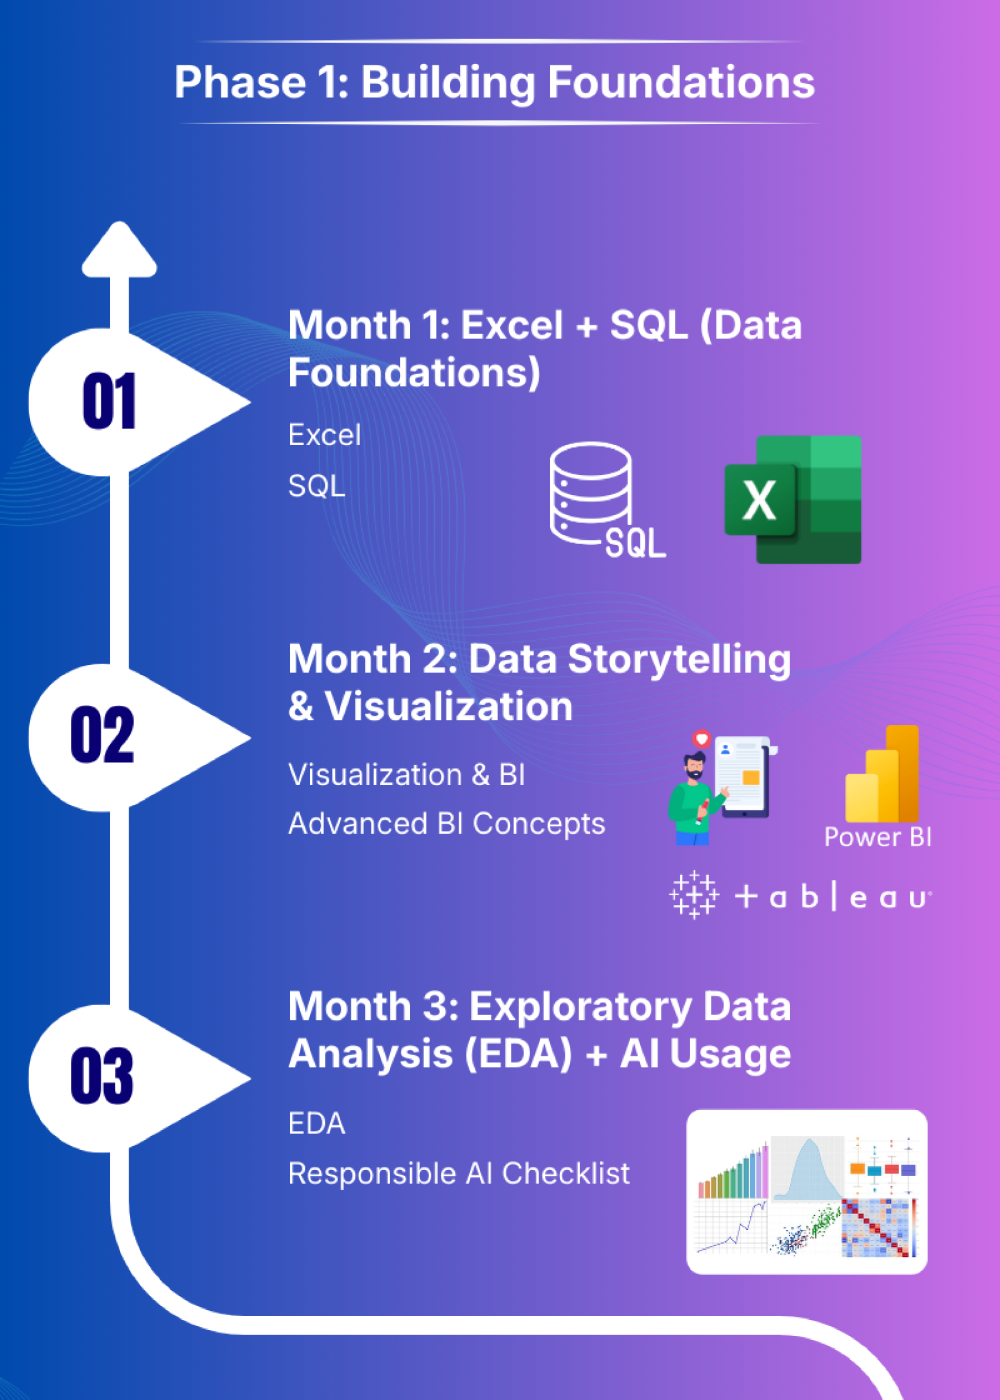
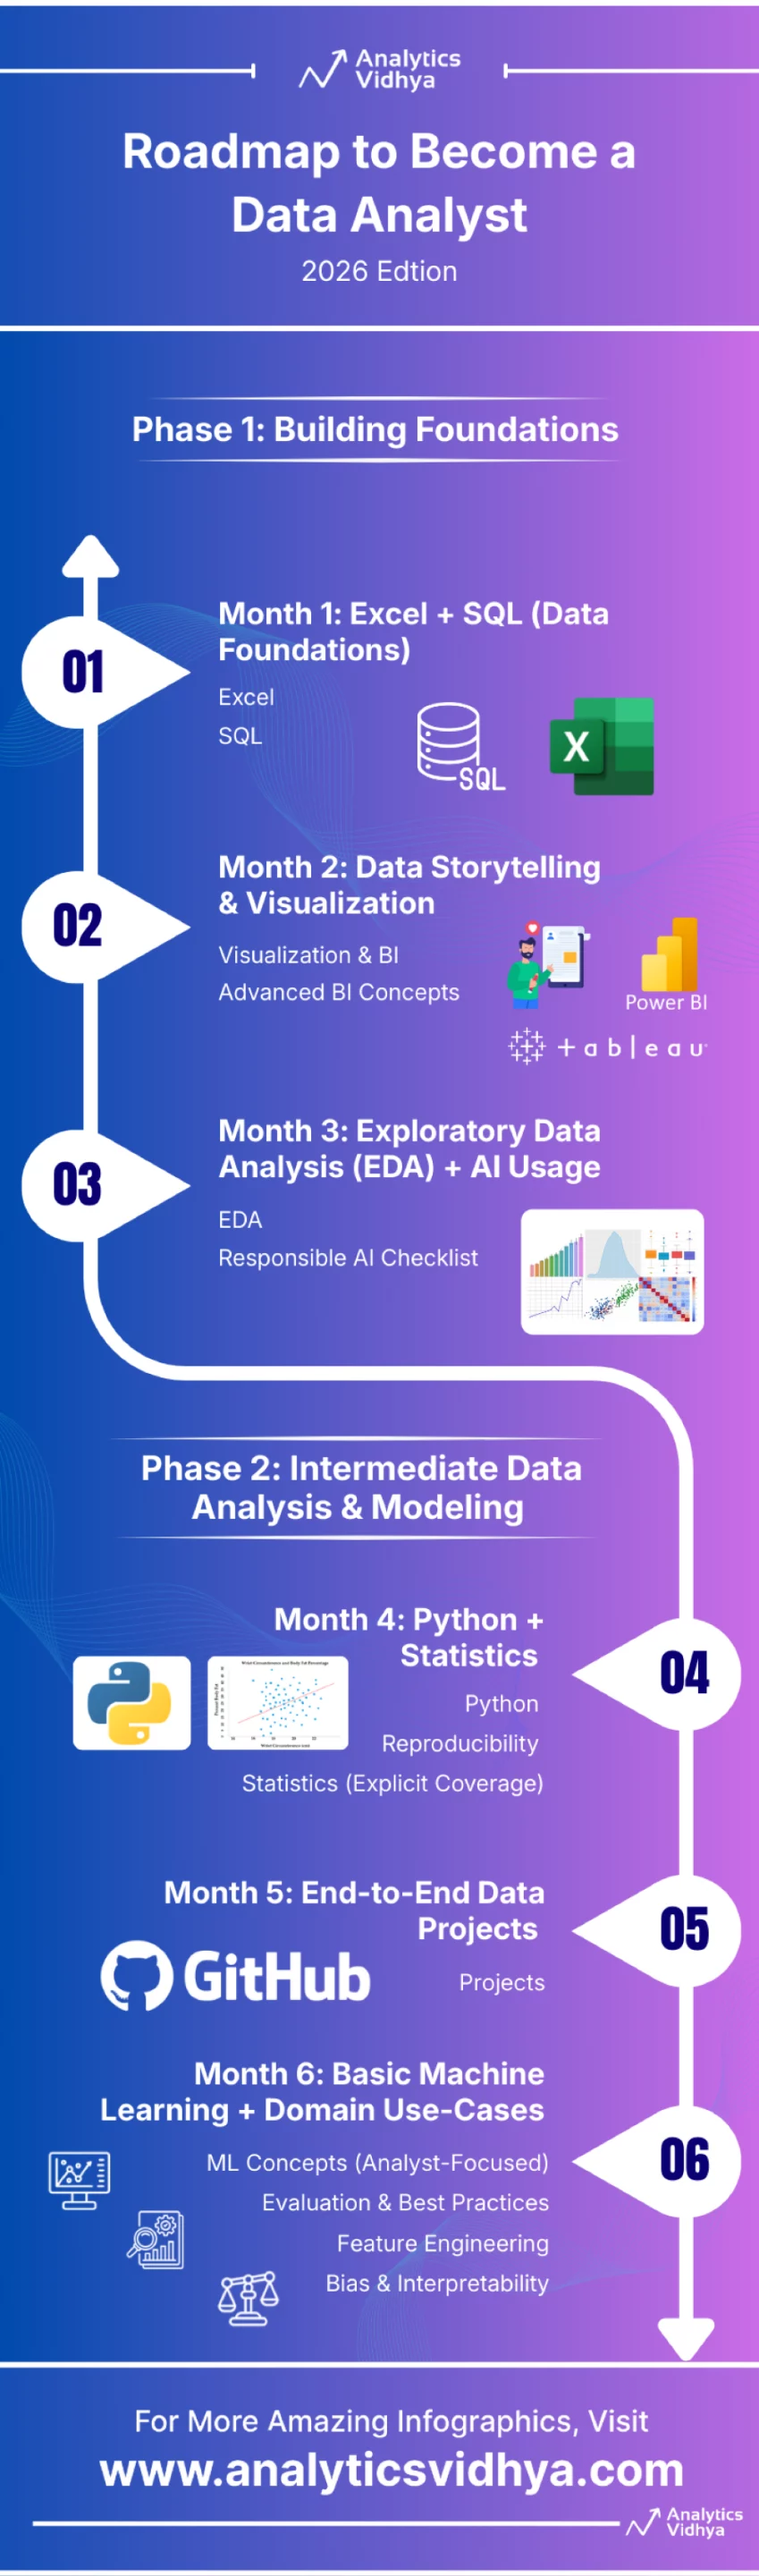
Phase 1: Building Foundations
Phase 1 focuses on building the core analytical muscles every data analyst must have before touching advanced tools or machine learning within a roadmap. This phase emphasizes structured thinking, clean data handling, and analytical logic using industry-standard tools such as Excel, SQL, and BI platforms. Instead of superficial exposure, the goal is depth—writing clean SQL, building automated Excel workflows, and learning how to explain insights visually. By the end of this phase, learners should feel comfortable working with raw datasets, performing exploratory analysis, and communicating insights clearly. Phase 1 lays the groundwork for everything that follows, ensuring you don’t rely on fragile shortcuts or copy-paste analysis later in your career.
Month 0: Absolute Basics (Preparation Month)
Before diving into advanced Excel, SQL, and BI tools, learners should spend Month 0 building absolute fundamentals. This is especially important for beginners or career switchers.
Focus Areas:
- Basic Excel formulas like SUM, AVERAGE, COUNT, IF, AND, OR
- Understanding rows, columns, sheets, and cell references
- Sorting and filtering data
- Basic charts (bar, line, column)
- Understanding what data types are (numbers, text, dates)
Goal:
Become comfortable navigating spreadsheets and thinking in rows, columns, and logic before introducing advanced functions or automation.
Month 1: Excel + SQL (Data Foundations)
Excel + SQL (Data Foundations) focuses on building strong, job-ready data handling skills by combining advanced Excel workflows with clean, scalable SQL querying. By the end of this month, learners will replace manual reporting with automated pipelines, write interview-grade SQL, and confidently handle complex analytical logic across tools.
Excel
- Advanced Excel functions: VLOOKUP/XLOOKUP, Pivot Tables, Charts
- Power Query for data cleaning & transformations
- Excel Tables, named ranges, structured references
SQL
- Core SQL: SELECT, WHERE, GROUP BY, HAVING, JOINs
- Advanced SQL (interview-focused):
– CTEs (WITH clauses)
– Window functions (ROW_NUMBER, RANK, LAG, LEAD)
– Basic performance concepts (indexes, query optimization intuition)
Outcome
Here are the three outcomes:
- Zero-Touch Automation: You will replace manual data entry with automated workflows by feeding SQL queries directly into Power Query for “one-click” report refreshes.
- Complex Analytical Power: You will handle sophisticated logic,like running totals, year-over-year growth, and rankings, using SQL Window Functions and Excel Pivot Tables.
- Professional Code Quality: You will write clean, scalable, and interview-passing code using CTEs (SQL) and Structured References (Excel) rather than messy, fragile formulas.
Month 2: Data Storytelling & Visualization
Month 2: Data Storytelling & Visualization shifts the focus from analysis to communication, teaching you how to translate raw data into clear, compelling stories using BI tools. By the end of this month, you will publish an interactive dashboard and confidently explain insights to non-technical stakeholders through visuals and narrative.
Visualization & BI
- Choose one BI tool based on interest/market demand:
– Tableau
– Power BI
– Qlik - Build dashboards using real datasets (COVID-19, sports, business KPIs)
- Publish at least one interactive dashboard:
– Tableau Public
– Power BI Service
Advanced BI Concepts
- Learn:
– Basic DAX (Power BI)
– Tableau LOD expressions - Perform data cleaning directly inside BI tools:
– Power Query
– data transforms
Outcome
- 1 live interactive dashboard
- Short written explanation of insights (storytelling focus)
Month 3: Exploratory Data Analysis (EDA) + AI Usage
Month 3: Exploratory Data Analysis (EDA) + AI Usage focuses on deeply understanding data quality, patterns, and risks before drawing any conclusions.
EDA
- Univariate & bivariate analysis
- Data quality checks:
– Missing value patterns
– Duplicates
– Outliers
– Distribution drift
AI / LLM Integration
Use LLMs to:
- Ask better EDA questions (missing data, anomalies, useful segmentations)
- Suggest appropriate visualizations based on data type and goal
- Summarize findings into clear, business-friendly insights
- Challenge conclusions by highlighting assumptions or gaps
- Speed up documentation (notebook notes, slide outlines, portfolio text)
Example:
1. EDA Discovery & Question Framing (MOST IMPORTANT)
Given this dataset’s schema and sample rows, what are the most important exploratory questions I should ask to understand key patterns, risks, and opportunities?
Follow-up:
Which columns are likely drivers of variation in the target KPI, and why should they be explored first?
2. Visualization & Storytelling Guidance
Based on the data type and business goal, what visualization would best explain this trend to a non-technical stakeholder?
Alternative:
How can I visualize seasonality, trends, or cohort behavior in this data in a way that is easy to interpret?
3. Insight Summarization for Business
Summarize the key insights from this analysis in 5 concise bullet points suitable for a non-technical manager.
Executive version:
Convert these findings into a one-page insight summary with key takeaways and recommended actions.
Guardrails
- Never share sensitive or personal data
- Always validate LLM outputs against actual analysis
Outcome
Faster EDA, clearer insights, better communication with stakeholders
Responsible AI Checklist
When using LLMs and AI tools during analysis, always follow these guardrails:
- Never upload PII or sensitive business data
- Treat LLMs as assistants, not decision-makers
- Be cautious of hallucinations and incorrect assumptions
- Always manually verify AI-generated insights against actual data and calculations
- Validate logic, numbers, and conclusions independently
Note: LLMs can confidently generate incorrect or misleading outputs. They should be used to accelerate thinking—not replace analytical judgment.
Soft Skills
- Present insights verbally
- Write short blog posts / slide decks / video explainers
Outcome
Here are the three outcomes:
- Systematic Data Vetting: You will master EDA to systematically diagnose dataset health, identifying every issue from outliers to distribution drift before any final analysis or modeling.
- Responsible AI Acceleration: You will use LLMs to quickly generate visualization suggestions and insight summaries, strictly adhering to the Responsible AI Checklist (no PII, manual validation).
- Actionable Insight Delivery: You will translate complex findings into persuasive outputs by mastering soft skillslike verbal presentation and creating clear, high-impact slide decks or blog posts.
Phase 2: Intermediate Data Analysis & Modeling
Phase 2 transitions learners from tool usage to analytical reasoning and modeling. Python and statistics are introduced not as abstract concepts, but as practical tools for answering business questions with evidence. This phase teaches how to work with real-world datasets, perform statistical testing, and build reproducible analyses that others can trust. Learners also get their first exposure to machine learning from an analyst’s perspective—focusing on interpretation rather than black-box optimization. By the end of Phase 2, you should be capable of running end-to-end analyses independently, validating assumptions, and explaining results using both code and visuals.
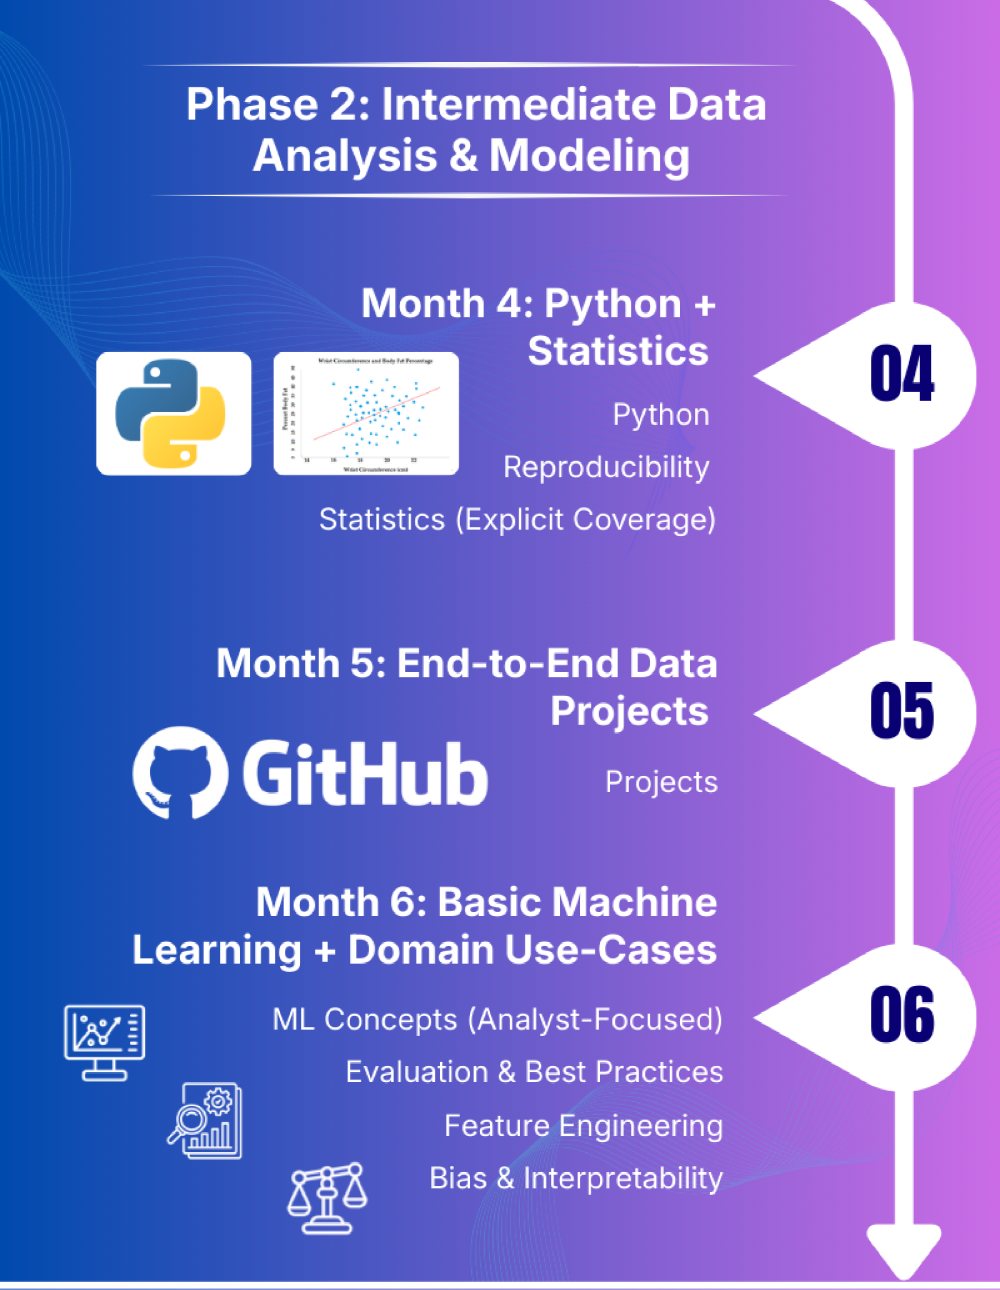
Month 4: Python + Statistics
Month 4: Python + Statistics introduces code-driven analysis and statistical reasoning to support defensible, data-backed decisions. You will use Python and core statistical techniques to run experiments, visualize results, and deliver reproducible analyses that stakeholders can trust.
Python
- Pandas, NumPy
- Matplotlib / Seaborn
- Key skills:
– Datetime handling
– GroupBy patterns
– Joins & merges
– Working with large CSV files
Reproducibility
- Use Jupyter Notebook / Google Colab
- Clear narrative markdown cells
- Maintain a requirements.txt or environment setup
Statistics (Explicit Coverage)
- Descriptive statistics
- Confidence intervals
- Hypothesis testing:
– t-tests
– Chi-square tests
– ANOVA - Regression basics (linear & logistic)
- Effect size & interpretation
- Practical exercises tied to datasets
Outcome
Here are the three core outcomes
- Code-Driven Experimentation: You will use Pandas and NumPy to execute formal statistical tests (t-tests, ANOVA) and determine Effect Size for defensible, data-backed conclusions.
- Scalable Visual Analysis: You will efficiently process large data files using advanced Pandas techniques and communicate findings effectively using Matplotlib/Seaborn visualizations.
- Reproducible Project Delivery: You will create fully documented, shareable projects using Jupyter Notebookswith narrative markdown and requirements.txt for guaranteed reproducibility.
Month 5: End-to-End Data Projects
Month 5: End-to-End Data Projects focuses on applying everything learned so far to real business problems from start to finish. You will deliver polished, portfolio-ready projects that demonstrate structured thinking, analytical depth, and clear communication to non-technical stakeholders.
Select 2–3 real-world problem statements. Each project must include:
- Clear business question
- Defined KPIs
- Data cleaning → EDA → visualization → analysis
- GitHub repository with README
- Final 5–7 slide deck aimed at non-technical stakeholders
Quality & Reliability
- Add basic unit tests or sanity checks:
– Row counts
– Null thresholds
– Schema checks
Outcome
- 2 polished, end-to-end projects
- Strong portfolio-ready assets
Month 6: Basic Machine Learning + Domain Use-Cases
Month 6: Basic Machine Learning + Domain Use-Cases introduces predictive analytics from an analyst’s perspective, emphasizing interpretation over complexity. You will build simple, explainable models and clearly communicate what the model predicts, why it predicts it, and where it should or should not be trusted.
ML Concepts (Analyst-Focused)
- Algorithms:
– Linear Regression
– Logistic Regression
– Decision Trees
– KNN
Evaluation & Best Practices
Regression:
- RMSE, MAE
- R² (interpretability, not optimization)
- MAPE (with caution for small denominators)
Classification:
- Precision, Recall
- F1-score (balance between precision & recall)
- ROC-AUC
- Confusion Matrix (error type analysis)
Feature Engineering
- Scaling
- Encoding
- Simple transformations
Bias & Interpretability
- Coefficient interpretation
- Intro to SHAP / feature importance
Outcome
- 1 predictive analytics project
- Clear explanation of model decisions
Hiring, AI Integration & Professional Readiness
After completing the core technical roadmap for a data analyst, the focus shifts toward employability and professional readiness. This phase prepares learners for real hiring scenarios, where communication, business understanding, and clarity of thought matter as much as technical skill. You will learn how to use AI to generate reports, summarize dashboards, and explain insights to non-technical stakeholders—without compromising ethics or accuracy. Portfolio refinement, resume optimization, mock interviews, and networking play a central role here. The objective is simple: make you interview-ready, project-confident, and capable of adding value from day one in a data analyst role.
AI / LLM Integration
Use LLMs to:
- Generate narrative reports
- Explain trends to business users
- Summarize dashboards
Soft & Business Skills
- Stakeholder thinking
- Translating insights into business actions
- Presenting to non-technical audiences
Portfolio & Job Preparation
- Finalize 3–4 strong projects
- Resume, LinkedIn, GitHub optimized for Data Analyst roles
- Practice interview questions:
– SQL
– Excel
– Statistics
– Business case studies
– Data storytelling
Interview Practice
- SQL + Excel timed drills (30–45 mins)
- At least 10 mock interviews (technical + case-based)
Applications & Networking
- Apply for full-time roles, internships, freelance gigs
- Kaggle competitions, hackathons
- Join analytics communities, webinars, workshops
- Stay updated on data ethics, AI & privacy
Recommended Project Ideas (Pick Any 3)
Projects are the strongest proof of your analytical ability. This section of the Data Analyst Roadmap for 2026 provides domain-driven project ideas that closely resemble real-world analyst work in product, marketing, and operations teams. Each project is designed to combine data cleaning, analysis, visualization, and storytelling into a single coherent narrative. Rather than chasing flashy models, these projects emphasize business questions, KPIs, and decision-making. Completing at least three well-documented projects from this list will give you portfolio assets that recruiters actually care about—clear problem framing, solid analysis, and actionable insights presented in a business-friendly format.
- Product Analytics
– Funnel conversion analysis
– Retention & cohort analysis - Marketing Analytics
– Campaign attribution
– LTV estimation - Operations Analytics
– Supply chain lead-time analysis
– Simple time-series aggregation & forecasting
Each project must include
- 1 notebook
- 1 dashboard
- 1 concise business story (5 slides)
Conclusion
This data analyst roadmap is designed to move you from fundamentals to professional readiness with clarity and intent.
Rather than chasing tools blindly, the roadmap emphasizes strong foundations, structured thinking, and real-world application across each phase. By progressing from Excel and SQL to Python, statistics, visualization, and responsible AI usage, you build skills that directly map to industry expectations. Most importantly, this data analyst roadmap prioritizes communication, reproducibility, and business impact – areas where many analysts struggle. If followed with discipline and hands-on practice, this path will not only prepare you for interviews but also help you perform confidently once you’re on the job.
Data Analyst with over 2 years of experience in leveraging data insights to drive informed decisions. Passionate about solving complex problems and exploring new trends in analytics. When not diving deep into data, I enjoy playing chess, singing, and writing shayari.


