Have you ever wondered how commentators can accurately tell about a player’s form or summarize key stats quickly during the game? The magic of sports analytics allows sports fanatics to collect, evaluate, and make in-depth decisions to improve performance.
Machine learning plays a key role in this, as it can analyze data about players and matches to identify the hidden patterns. By observing these patterns, coaches can now prepare personalized game plans for their players. In the modern era of sports, analytics is used to help teams identify ways to train smarter, identify players for recruitment, and basically, plan their strategies. This article will acquaint you with the current state of machine learning in the domain of sports, and would follow it up with a demonstration of implementing one.
Table of contents
Foundations of Machine Learning in Sports
Machine learning, a subfield of AI that creates systems that learn from data. In sports, ML has to manage and process multiple types of data to complete tasks such as prediction and pattern finding. For example, computer-vision models can handle game video to automatically track the location of players and the ball. These algorithms use different features, such as speed, distance of shot, biometrics, etc., to make data-driven predictions. As more data is added over time, these models typically improve. Data preprocessing and feature engineering are very important steps to present the right information to these models, which can be retrained each season as new match data is available.
Types of ML Algorithms Used in Sports
- Supervised learning: Uses algorithms (e.g., regression algorithms like linear, polynomial, and decision trees regressor, and more) on existing labeled data, on the targeting column for predicting an outcome (win/lose) or specific player statistics (goals, possessions, etc.).
- Unsupervised learning: Utilizes clustering and association methods for finding potential placements in groups or play styles across players.
- Reinforcement learning: Encompasses learning strategies through trial-and-error feedback processes based on the reward system, such as tactics simulated in games.
- Deep learning: Can analyze very challenging data, such as forms of signals, including recognizing actions through video or analyzing sensor data.
Each of these can serve a specific purpose. The role of supervised models and methods is to predict scores (numeric) or classifications (categorical). The role of unsupervised learning is to identify groups or hidden patterns (roles) in the structure among players. Reinforcement learning can simulate complete game strategies. Deep networks can tackle complicated, high-dimensional data, such as unique images or time series. Using some combinations of these methods can provide richer information/output, which may enhance the performance.
Data Sources in Sports
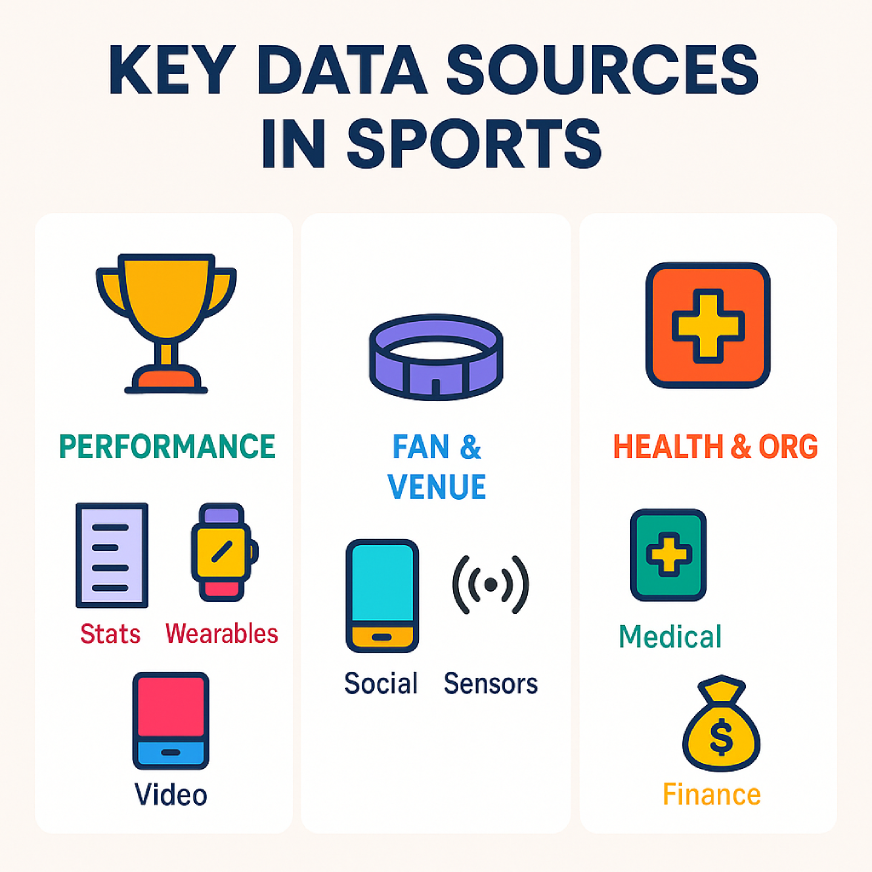
Sports analytics uses several types of data. Performance metrics (points, goals, assists, passes) come from official game records and event logs. Wearable devices (GPS trackers, accelerometers, heart monitors,and smart clothing) provide biometrics, such as speed, acceleration, and heart rate. Video cameras and video-tracking systems with automatic and trained human coders provide surveillance of movements, formations, and ball trajectories.
Fan and social-media data provide information related to fan engagement, sentiment, and viewing. Connected stadium sensors (IoT) can record fan noise, temperature, or weather data, as well. Medical records, injury records, and financial data (salaries and budgets) also provide data to analytics. All these datasets need careful integration. When synthesized together, such sources offer a more complete data universe about teams, players, fan behavior, and leagues.
Hands-On: Predicting Match Outcomes Using Machine Learning
Importing the Libraries
Before proceeding further, let’s import all the important libraries that will be helping us throughout this analysis.
# 1. Load Required Libraries

import pandas as pd

import numpy as np

import matplotlib.pyplot as plt

import seaborn as sns

from sklearn.impute import SimpleImputer

from sklearn.model_selection import train_test_split

from sklearn.preprocessing import LabelEncoder, StandardScaler

from sklearn.pipeline import Pipeline

from sklearn.metrics import accuracy_score,classification_report

from sklearn.ensemble import RandomForestClassifier

import warnings

warnings.filterwarnings("ignore")
Problem Statement
This is a multi-class classification problem: predicting a team’s result (W/D/L) based on the match stats. We assume features (e.g., xG, shots, poss, etc.) are available. The workflow is to preprocess the data, split it into training/testing, train a model, and then evaluate the predictions.
Dataset Overview (matches_full.csv)
We have a source dataset of 4,318 professional soccer matches (2019–2025 seasons). Each row in the data indicates one team’s performance in a game: goals for/against, expected goals (xG), possession %, shots, fouls, etc. There is a result column indicating Win/Draw/Loss for that team. We conceptualize this as an example “cricket” scenario, or any sport, that could apply and develop a model to predict the match result for a team. You can download the dataset from here.
df = pd.read_csv('matches_full.csv')

print("Initial shape:", df.shape)

# Initial shape: (4318, 29)
Data Preprocessing & Model Training
During this stage, we cleansed the data by removing any repetitive or irrelevant columns not related to our prediction task. In our case, that includes any metadata that could be found in Unnamed: 0, date/time columns, or columns that solely contain texts such as the match report or the notes.
# # Drop unnecessary columns

df.drop(['Unnamed: 0', 'date', 'time', 'match report', 'notes'], axis=1, inplace=True)

# Drop rows with missing target values

df.dropna(subset=['result'], inplace=True)
Label Encoding for Categorical Data
Since machine learning models only work with numbers, we translated categorical text columns into numeric values (such as opponent, venue, captain, etc.) using Label Encoding. Each value in a categorical column is converted into a number. We saved the encoders so that we can use them later to reverse convert categorical columns into their original state.
# 3. Label Encoding for Categorical Columns

label_cols = ['comp', 'round', 'day', 'venue', 'opponent', 'captain',

             'formation', 'opp formation', 'referee', 'team']

label_encoders = {}

for col in label_cols:

   if col in df.columns:  # Check if column exists

       le = LabelEncoder()

       df[col] = le.fit_transform(df[col].astype(str))

       label_encoders[col] = le
Encoding the Target Variable
We converted the target column (result) into numeric values. For example, W (win), L (loss), and D (draw) will be encoded as 2, 1, and 0, respectively. This allows the model to treat the output predicted as a classification task.
# Encode target separately

result_encoder = LabelEncoder()

df['result_label'] = result_encoder.fit_transform(df['result'])
Before we start building a model, we take a look at the data visually. The initial plot shows approximately how the team’s average goals scored (gf) changes over the different seasons. We can see consistent patterns and areas where the team either performed stronger or weaker.
# Store original mapping

result_mapping = dict(zip(result_encoder.classes_, result_encoder.transform(result_encoder.classes_)))

print("Result mapping:", result_mapping)

#Result mapping: {'D': 0, 'L': 1, 'W': 2}
Before moving on the building our model, we take a visual first look at the data. This plot shows the average goals scored (gf) by the team over the different seasons. It allows us to visualize trends and performance patterns.
# Trend of Average Goals Over Seasons

if 'season' in df.columns and 'gf' in df.columns:

   season_avg = df.groupby('season')['gf'].mean().reset_index()
   plt.figure(figsize=(10, 6))
   sns.lineplot(data=season_avg, x='season', y='gf', marker='o')

   plt.title('Average Goals For Over Seasons')

   plt.ylabel('Average Goals For')

   plt.xlabel('Season')

   plt.xticks(rotation=45)

   plt.tight_layout()

   plt.show()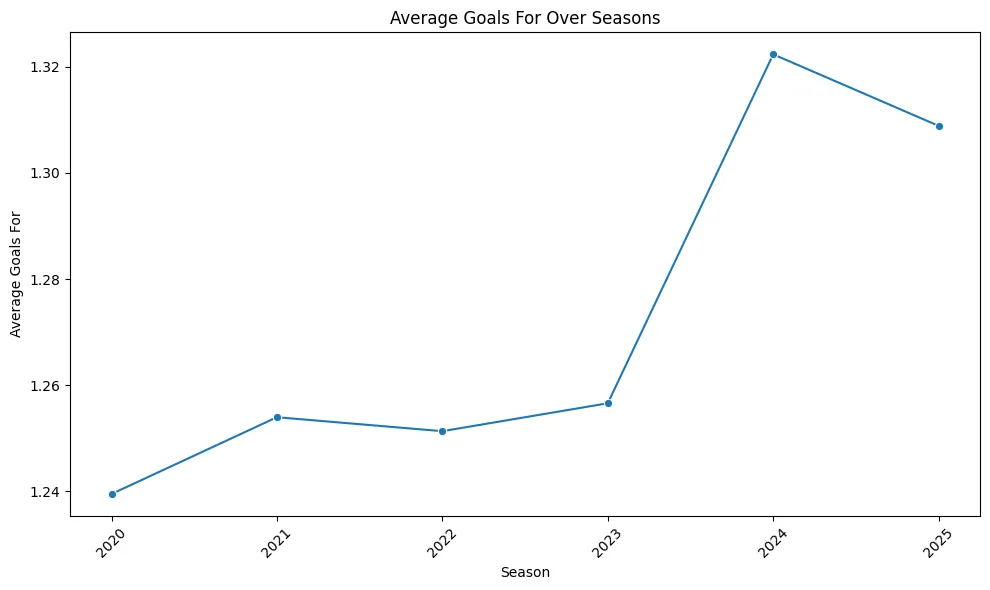
In this plot, we can see a histogram showing how regularly certain goal numbers (gf) were scored. This can give us good insight into whether the majority of games were low-scoring games or high-scoring games and how dispersed those scores were.
# Goals Scored Distribution

if 'gf' in df.columns:

   plt.figure(figsize=(8, 6))

   sns.histplot(df['gf'], kde=True, bins=30)

   plt.title("Goals Scored Distribution")

   plt.xlabel('Goals For')

   plt.ylabel('Frequency')

   plt.tight_layout()

   plt.show()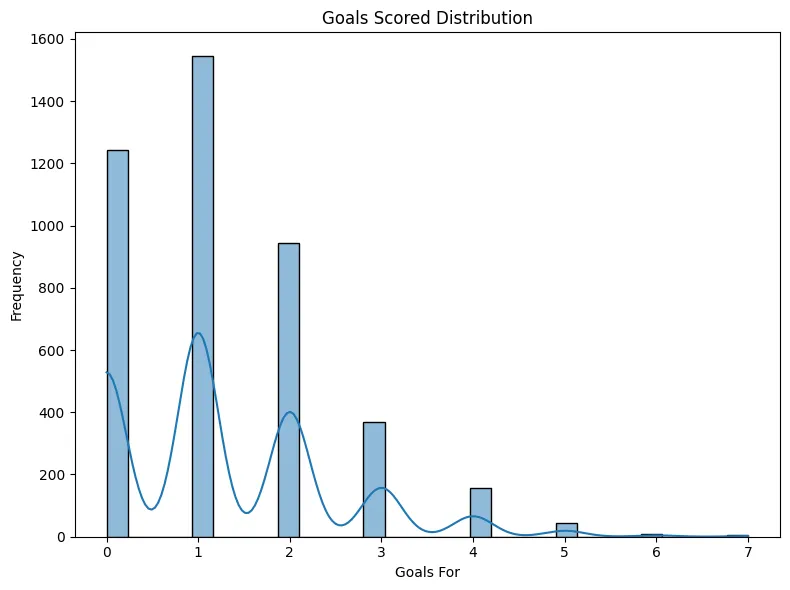
Feature and Target Split: We separate the input features (X) from the target labels (y) and separate the dataset into training and test sets in order to be able to assess the model performance on unseen data.
# 4. Feature Selection

X = df.drop(columns=['result', 'result_label'])

y = df['result_label']

X_train, X_test, y_train, y_test = train_test_split(X, y, test_size=0.2, random_state=42, stratify=y)
Training and Assessing the Model: This function will build a machine learning pipeline. It takes care of:
- Missing value imputation
- Feature scaling
- Model training
Then we’ll use the accuracy metric and a classification report to assess how well the model performed. We can easily call this function again later for a different model (e.g., Random Forest)
def train_and_evaluate(model, model_name):

   # Create imputer for missing values

   imputer = SimpleImputer(strategy='mean')

   # Create pipeline

   pipe = Pipeline([

       ('imputer', imputer),

       ('scaler', StandardScaler()),  # For models sensitive to feature scaling

       ('clf', model)

   ])

   # Train the model

   pipe.fit(X_train, y_train)

   y_pred = pipe.predict(X_test)

   # Calculate metrics

   acc = accuracy_score(y_test, y_pred)

   report = classification_report(y_test, y_pred, target_names=result_encoder.classes_)

   print(f"\n {model_name}")

   print(f"Accuracy: {acc:.4f}")

   print("Classification Report:\n", report)

   return pipe, acc
Training Random Forest Classifier: Lastly, we’re going to train a Random Forest model through the pipeline. Random Forest is certainly a popular, powerful ensemble model that we can expect to pay off as it often does well on structured datasets like this one. We also store the trained classifier for later analysis of feature importance.
rf_model, rf_acc = train_and_evaluate(RandomForestClassifier(n_estimators=250, random_state=42), "Random Forest")

# Store the best model for feature importance

rf = rf_model.named_steps['clf']
Output:
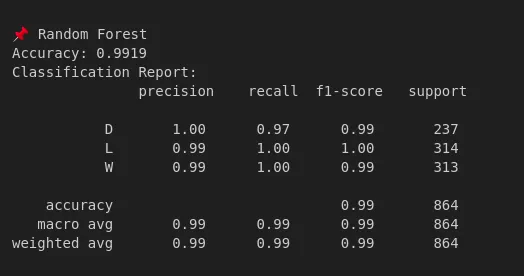
The Random Forest model performed well with an accuracy of 99.19%. It accurately predicted wins, draws, and loss situations with graphical representations attached to them, with evidence of more. The fact that machine learning can be of assistance in interpreting match outcomes efficiently with data, even with minimal mistakes, presents value for sports outcomes, but also provides useful insight into team performance through past match statistics, as shown below.
Applications of ML in Sports
Modern sports are heavily reliant on machine learning. It helps teams create better game plans, decrease injuries, increase player performance, and even increase fan engagement. Let’s examine the various applications of ML in sports.
Player Performance Evaluation
ML allows an objective assessment of player performance. Models can analyze detailed match data (e.g., shot zones, pass patterns) to measure a player’s skills and project future performance levels. For example, analysts can use ML to analyze weaknesses or strengths in an athlete’s technique, including subtle aspects that scouts may fail to recognize. This helps in finding significant opportunities to evaluate talent and customize training interventions for identified weaknesses.
For example, Baseball analyst uses sabermetrics and rely on ML while soccer models estimate expected goals, assess the quality of scoring attempts. Dozens of teams are also now adopting motion sensors to measure technique (e.g., swing speed or kicking force) which could help coaches specifically tailor workout and performance strategies for each athlete.
Injury Prediction & Load Management
One of the most popular application of ML is in healthcare management aspect of sports analytics. Models analyze a player’s training load, biomechanics, and previous injury reports to assign injury risk flags. For example, teams are monitoring players using a ‘watch’ along with footpads and monitoring heart rate, acceleration, and fatigue to detect overload indicators.
The goal is to use that data to alert training staff to alter a player’s workload or training plan before injury. Research shows that these proactive systems enhance injury prevention by identifying patterns that are often imperceptible to coaches. The goal is to minimize player injury throughout he season and decrease the player’s downtime.
Tactical Decision Making
Coaches are leveraging the power of AI within Machine Learning to enhance their game strategy. Algorithms can analyze historical and real-time match data to suggest alternative tactics and formations. This gives coaches the ability to deep dive into their opposition using automated analysis. This incorporates their tactical tendencies that would bolster any team’s strategic thinking.
When incorporating multiple model predictions, coaches will also be aided in forecasting outcomes to help consider the likely moves of their opposition. Some coaches are engaging agents to simulate specific game scenarios using reinforcement learning (RL) to help them try new tactics. Collectively, these ML and AI applications can contribute to strategic and in-game planning effectively.
Fan Engagement & Broadcasting
Off the field, AI and ML are enhancing the fan experience. Professional teams are analyzing fan data to personalize content, offers, and interactive experiences. For example, teams are utilizing AI-driven AR/VR applications and customizable highlight reels to bring fans into their current season. AI-driven applications using ML are also helping sponsors to develop targeted marketing and personalized advertisements for segmented audiences based on preferences.
For example, teams are utilizing AI-driven AR/VR applications and customizable highlight reels to bring fans into their current season. AI-driven applications using ML are also helping sponsors to develop targeted marketing and personalized advertisements for segmented audiences based on preferences.
Challenges in ML-Driven Sports Analytics
Even though machine learning has many advantages in sports, it’s not always simple to use. When applying machine learning in actual sports settings, teams and analysts encounter a number of difficulties. Some of which are outlined below:
- Sports data is messy, inconsistent, and comes from various sources, so it might affect the reliability of the data or the associated uncertainty.
- Many teams have limited historical data, so naturally, there is a chance for the model to overfit to the data.
- Knowledge of the sport is critical: ML systems should be constructed within the actual game context and that of coaching practice.
- Unpredictable events (like sudden injuries or referee decisions) will limit generalisation or the accuracy of the predictions.
- Smaller clubs may not have the budget or the knowledge of staff to execute ML at scale.
All these factors mean that using ML in sports requires considerable domain expertise and careful judgment.
Conclusion
Machine learning is revolutionizing sports analytics with a data-drive analytical perspective. By accessing statistics, wearable information, and video, teams are able to explore and analyze player performance, strategies on the pitch, and engagement by fans. Our match prediction shows the core workflow of data wrangling, data preparation, training for a model, and review using statistics from matches.
By bringing together machine learning insights with coaching knowledge, teams will make better decisions and deliver better results. Using these principles, sports practitioners will be able to harness machine learning, resulting in data-informed decisions, improved athlete health, and a more satisfying fan experience than ever before.
Frequently Asked Questions
Q1. Can machine learning predict the outcome of a match accurately?
A. Machine learning can predict outcomes with decent accuracy, especially when trained on high-quality historical data. However, it’s not perfect; sports are unpredictable due to factors like injuries, referee decisions, or weather.
Q2. What are the most important features for predicting match results?
A. Commonly important features include goals scored, expected goals (xG), possession, number of shots, and venue (home/away). Feature importance varies depending on the sport and the dataset.
Q3. Do teams use ML models in real matches?
A. Yes! Many professional teams in football, cricket, basketball, and tennis use machine learning for tactics, player selection, and injury prevention. It complements human expertise, not replaces it.
Q4. Is domain knowledge necessary to build ML models in sports?
A. Absolutely. Knowing the sport helps in selecting relevant features, interpreting model results, and avoiding misleading conclusions. Data science and domain knowledge work best together.
Q5. Where can I get datasets to practice sports analytics?
A. You can find public datasets on Kaggle and official sports APIs. Many leagues also release historical data for analysis.
Hello! I'm Vipin, a passionate data science and machine learning enthusiast with a strong foundation in data analysis, machine learning algorithms, and programming. I have hands-on experience in building models, managing messy data, and solving real-world problems. My goal is to apply data-driven insights to create practical solutions that drive results. I'm eager to contribute my skills in a collaborative environment while continuing to learn and grow in the fields of Data Science, Machine Learning, and NLP.


