This article was published as a part of the Data Science Blogathon.
Quoting Peter Drucker, “What gets measured, gets managed.”
Have you ever pondered how we can measure the market and grow our business? In this article, I’m going to throw light on undifferentiated but distinguishable terminologies – “Analytics” and “Market/ Business”. But before that, let me present a real-life story.

Source – urbanadventureclub.com
Vaibhav* started an arcade of board games, which is not really a common thing these days, especially in the digital era where people are hardly interested in playing games physically with their friends.
Initially, he wanted to raise funds to equip the arcade with better facilities. So, he strategized his pricing policies by charging 400 bucks per head for 4 hours. Other than that, he used to provide complimentary drinks and snacks. The unique selling point was unlimited access to any sorts of board games.
But, after 6-7 months, he realized that his profit estimation was not sufficient to expand his business. It’s pretty evident that random planning without quantitative estimation didn’t help him achieve the desired results. Maybe the public wasn’t aware of such an innovative concept or the games’ genres weren’t attention-seeking or the location wasn’t posh; there could be ‘n’ number of reasons behind the business not working out.
Then what should we do?
Moving a step ahead, he designed a website to market his interesting yet infamous arcade. He performed market research to understand the design of popular websites. The website was pretty trending and had lots of captivating sections. Interesting and engaging games were available; a pretty niche concept I’d say.
He shared his website on various social media platforms among his networks like Facebook, Instagram, LinkedIn, Twitter, and even created a YouTube channel for the purpose of enhancing customer engagement and branding. He saw significant improvement in the business but it still wasn’t good enough.

Source: pxhere.com
Climbing up the ladder of digital marketing
Vaibhav now started promoting on various channels by investing in online paid advertisements. He also designed a knowledge hub on his website where the users could provide their details to retrieve information about the games available and provide an opinion about the games they are interested in.
This not only helped him gather details and notify the customers of various offers but also understand the audience’s flavor with respect to the games. The response of digitally promoted as well as of the knowledge hub was pretty amazing. He received various suggestions and hence optimized the website by including important keywords which added value to the content as per the audience’s expectations.
This is the concept of Search Engine Optimization (SEO) and Social Media Marketing (SMM).
Why was the public still not visiting his arcade?
Vaibhav realized the importance of the rapidly growing data and found that he had the opportunity to explore different varieties of details presented via knowledge hub as well as visitors to help him make key business decisions, not just limited to financial analysis but also the analysis of the role customer preferences, geography and demographics play in contributing to the growth of a business.
This is where he analyzed the visitors’ data which included their age groups, category of games they’re interested in, number of times they played the respective game, the duration for which they played a particular game, the total time spent in the arcade, and so on.
Using Google Analytics, he monitored the website traffic, considering metrics like landing pages, average time spent on the page, user interactivity, and navigation on different sections of the website.
Once he understood which section of the page people were showing an interest in, he started improving the website content for the pages which were less visited. For example, the first page in the report below shows the maximum number of sessions but a high bounce rate (percentage of sessions where users directly left the page without performing any further action) and average session duration.
The bounce rate coupled with average session duration indicates users’ interest(s) on the particular page and that some change may be required on the page.
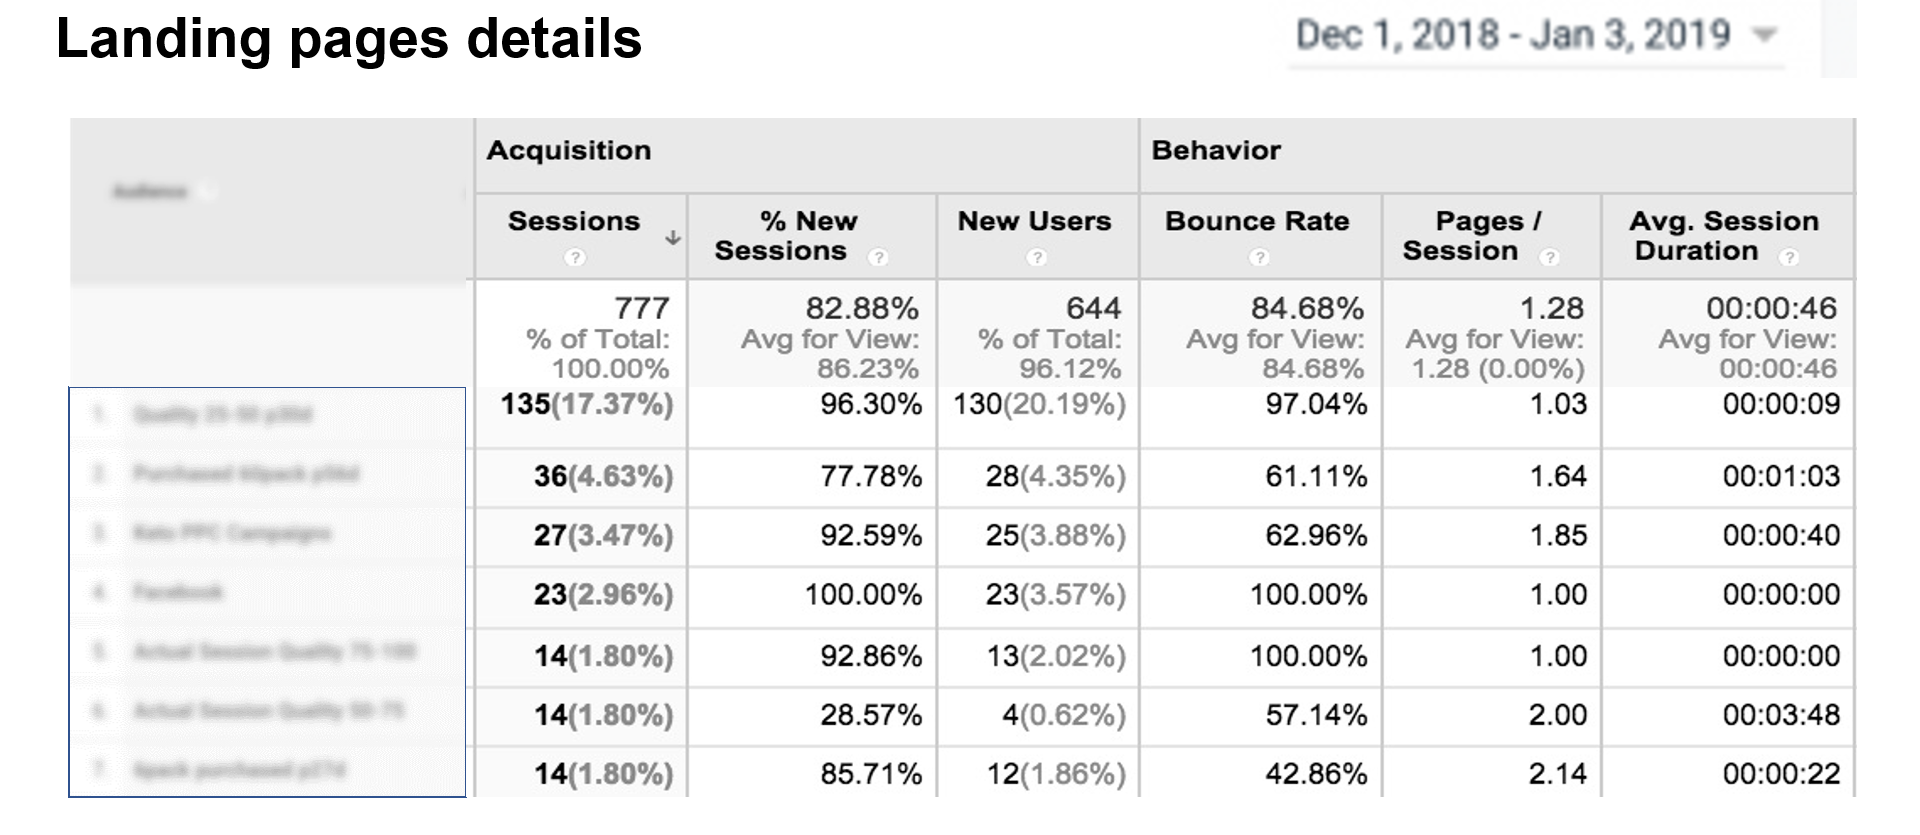
Google Analytics Report
Customer engagement on the website through different channels affects a website’s popularity to a great extent. Vaibhav inferred the source of marketing working out in his business’ favor by analyzing the source or the channels which redirected the users to his website and via which device.
For instance, mobile and tablet showed really less utilization. This signified that the website might not be mobile-friendly. Hence improvements were needed in website design in order to enhance activity on other devices as well.
Apart from the technical requirements, it is vital to understand how user engagement influences sales. The improvements in website and investment in email marketing helped him increase the site visits and hence the sales. More and more people started visiting his arcade over time, as indicated by the bottom right graph in the dashboard below:
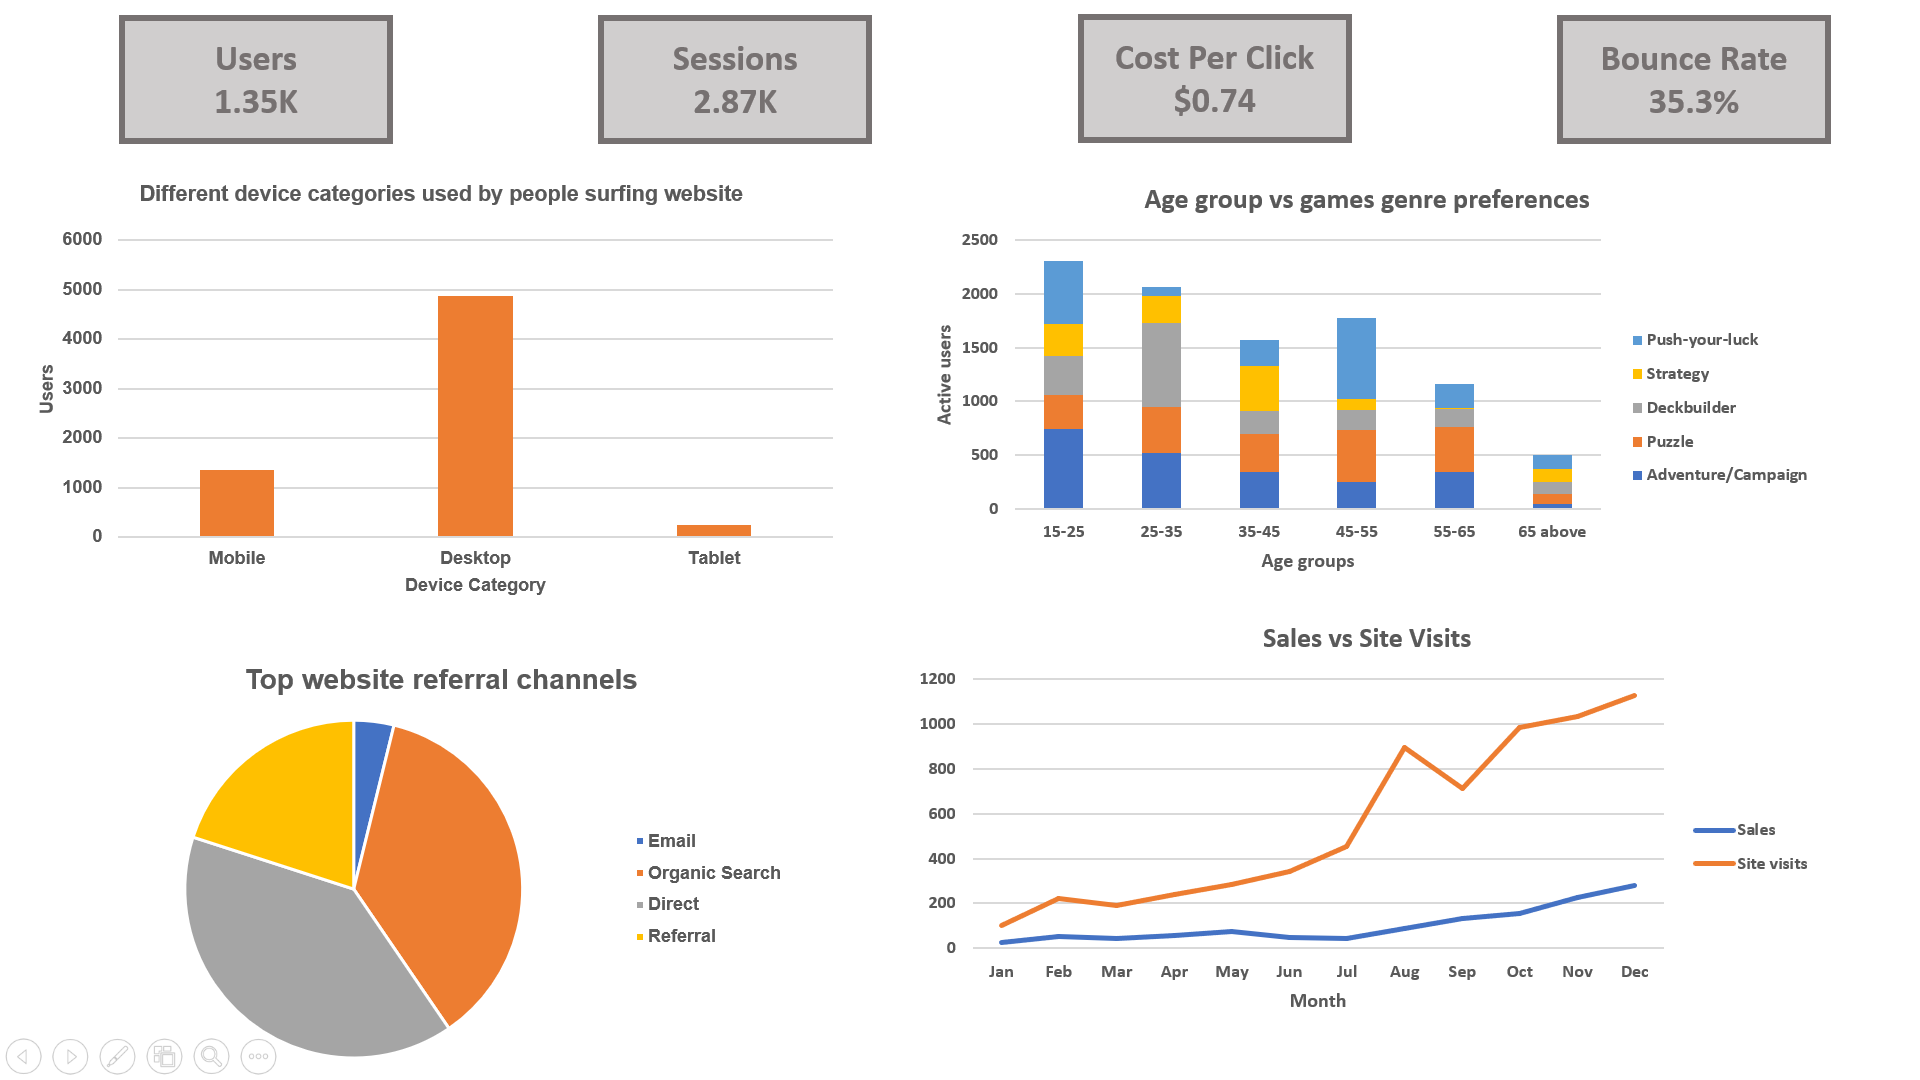
Dashboard prepared on Google Data Studio
Preparing a dashboard, using Power BI and Google Data Studio, to visualize the quantitative data related to website performance, social media marketing, and potential reach, helped him figure out the root cause of slow growth and the areas of improvement in the business.
How exactly did data contribute towards the rise of his arcade business?
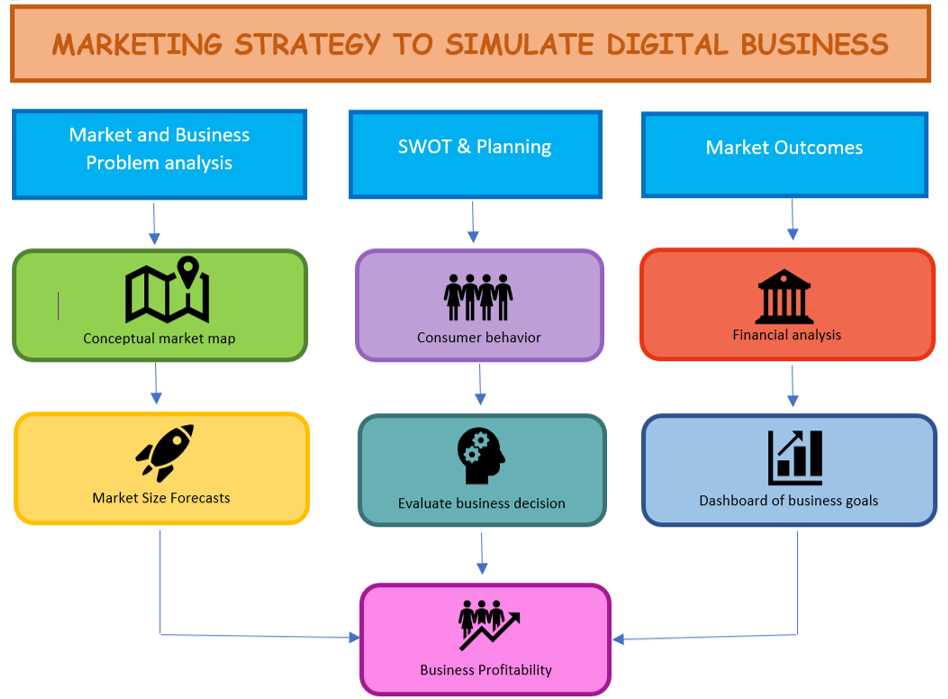
Vaibhav performed different types of business analytics activities such as descriptive analytics, predictive analytics, and prescriptive analytics. Now, what does all that mean?
- First, he tracked Key Performance Indicators, as mentioned in the above story, to understand the present state of his arcade business. This is nothing but descriptive analytics. He explored and comprehended the data he had collected from the knowledge hub as well as the public who visited his arcade
- Second, he applied statistical algorithms to historical data to make a prediction about the future performance of his arcade. He used various other advanced analytics techniques, like cluster analysis, to group customers based on similarities across several data points. This proved to be helpful in targeted marketing campaigns. Forecasting data seems to be the order of the day. He wanted to know where he will stand a couple of years in the future so that he can make confident decisions
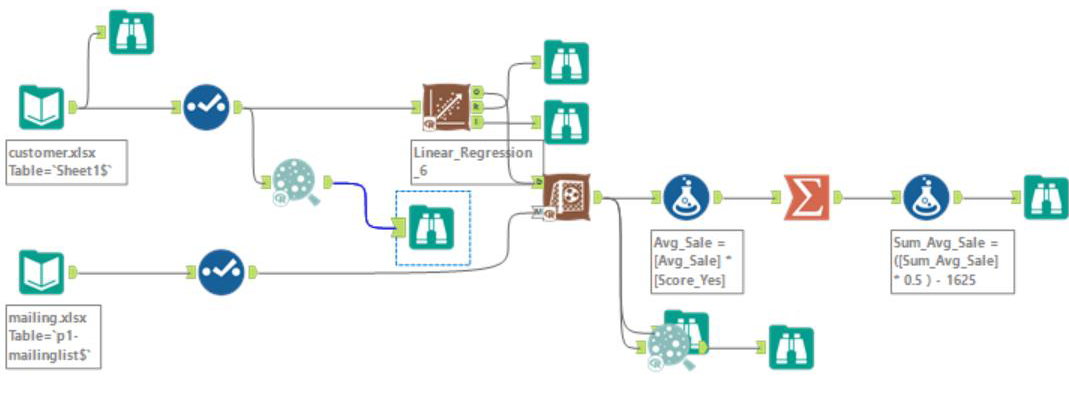
Using Alteryx, a tool used to create machine learning models in the form of workflows with in-built functionalities to be used in a drag-and-drop manner, Vaibhav created a predictive model and analyzed the trend data to assess the likelihood of future outcomes.
For example, he observed that the majority of the customers were of the age group up to 25 years old. Senior citizens were a rare sight. The middle-aged people were a minor group because of job commitments.
Further, he tried to relate the type of games each group played. These findings helped him to estimate the profits and make various assumptions for future performance. Within 3 years, they expected their profit to rise by 65%. This is predictive analytics.
- Finally, he applied the knowledge of prescriptive analytics which used the past performance to generate recommendations about how to handle similar situations in the future. For instance, he used these facts and conclusions to draft a proposal such as the variety of games which they should introduce and how to attract a specific set of people in the coming future. Apart from that, he also started recommending the games to new users based on existing customers’ preferences, reviews, and ratings
These parameters helped him to predict future performance along with improving his current standards of facilities. Finally, he enhanced his business by getting sponsorship, expanding the arcade area, installing ACs and vending machines, and collaborating with various nearby restaurants and hotels, offering people several discounts and vouchers. Apart from the original 4-hour plan, the arcade now had two other plans:
Weekdays:
10 am - 8 pm: 30% discount on 1000 bucks per head, which made it worth 700 bucks
Weekends:
10 am - 10 pm: 20% discount on 1200 bucks per head, which made it worth 960 bucks
End Notes
I find it’s running pretty well these days. I hope you would have developed a clear picture of the distinction but at the same time the inter-relationship between data analytics and marketing for digital businesses.
Given the recent developments in both data analytics as well as Marketing Analytics, businesses can expect a major shift in the way data is analyzed. This is how one can ratchet the critical business situation by sprinkling the knowledge of data analysis to the zenith of success and prosperity!
*The name of the person has been changed due to confidentiality.


Nice informative piece!!
Really insight full blog!
Wow, such an innovative and interesting approach indeed.