This article was published as a part of the Data Science Blogathon
Introduction
Hello Readers!!
In this blog going to learn and build a CNN model to classify the species of a seedling from an image. The dataset has 12 sets of images and our ultimate is to classify plant species from an image.
If you want to learn more about the dataset, check this Link. We are going to perform multiple steps such as importing the libraries and modules, reading images and resizing them, cleaning the images, preprocessing of images, model building, model training, reduce overfitting, and finally predictions on the testing dataset.
📌Check out my latest articles here
📌Solve Sudoku using Deep Learning, check here

Image Source
TABLE OF CONTENTS
- PROBLEM STATEMENT
- IMPORT LIBRARIES
- GETTING THE DATA AND RESIZING THE IMAGES
- CLEANING THE IMAGES AND REMOVING THE BACKGROUND
- CONVERTING THE LABELS INTO NUMBERS
- DEFINING OUR MODEL AND SPLITTING THE DATASET
- PREVENTING OVERFITTING
- DEFINING THE CONVOLUTIONAL NEURAL NETWORK
- FITTING THE CNN ONTO THE DATA
- CONFUSION MATRIX
- GETTING PREDICTIONS
PROBLEM STATEMENT
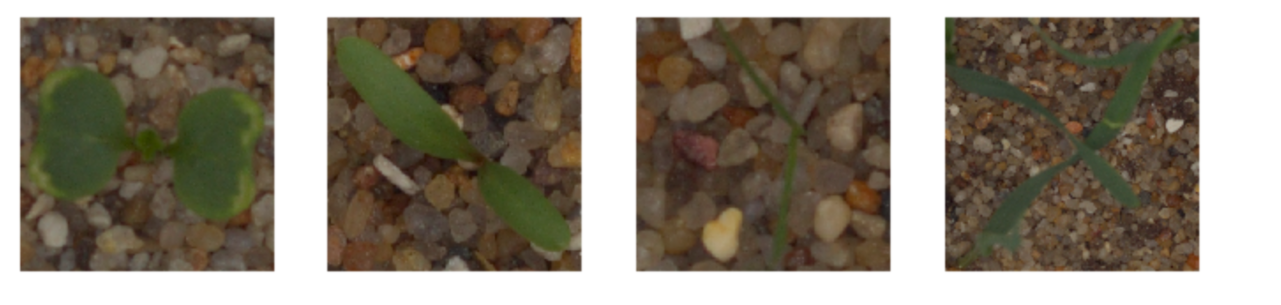
This dataset is provided by Aarhus University Signal Processing group. This is a typical image recognition problem statement. We have provided a dataset of images that has plant photos at various stages of growth. Each photo has its unique id and filename. The dataset contains 960 unique plants that are from 12 plant species. The final aim is to build a classifier that is capable to determine the plant species from a photo.
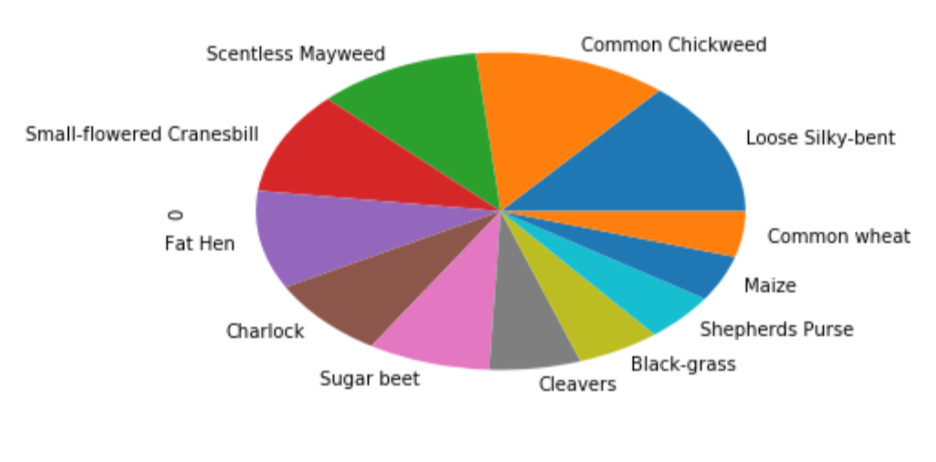
List of Species
- Black-grass
- Charlock
- Cleavers
- Common Chickweed
- Common wheat
- Fat Hen
- Loose Silky-bent
- Maize
- Scentless Mayweed
- Shepherds Purse
- Small-flowered Cranesbill
- Sugar beet
IMPORT LIBRARIES
First import all the necessary libraries for our further analysis. We are going to use NumPy, Pandas, matplotlib, OpenCV, Keras, and sci-kit-learn. Check the below commands for importing all the required libraries
import numpy as np # MATRIX OPERATIONS
import pandas as pd # EFFICIENT DATA STRUCTURES
import matplotlib.pyplot as plt # GRAPHING AND VISUALIZATIONS
import math # MATHEMATICAL OPERATIONS
import cv2 # IMAGE PROCESSING - OPENCV
from glob import glob # FILE OPERATIONS
import itertools
# KERAS AND SKLEARN MODULES
from keras.utils import np_utils
from keras.preprocessing.image import ImageDataGenerator
from keras.models import Sequential
from keras.layers import Dense
from keras.layers import Dropout
from keras.layers import Flatten
from keras.layers.convolutional import Conv2D
from keras.layers.convolutional import MaxPooling2D
from keras.layers import BatchNormalization
from keras.callbacks import ModelCheckpoint,ReduceLROnPlateau,CSVLogger
from sklearn import preprocessing
from sklearn.model_selection import train_test_split
from sklearn.metrics import confusion_matrix
# GLOBAL VARIABLES
scale = 70
seed = 7
GETTING THE DATA AND RESIZING THE IMAGES
For training our model, we need to read the data first. Our dataset has different sizes of images, so we are going to resize the images. Reading the data and resizing them are performed in a single step. Check the below code for complete information on how to perform different operations.
path_to_images = 'plant-seedlings-classification/train/png'
images = glob(path_to_images)
trainingset = []
traininglabels = []
num = len(images)
count = 1
#READING IMAGES AND RESIZING THEM
for i in images:
    print(str(count)+'/'+str(num),end='r')
    trainingset.append(cv2.resize(cv2.imread(i),(scale,scale)))
    traininglabels.append(i.split('/')[-2])
    count=count+1
trainingset = np.asarray(trainingset)
traininglabels = pd.DataFrame(traininglabels)

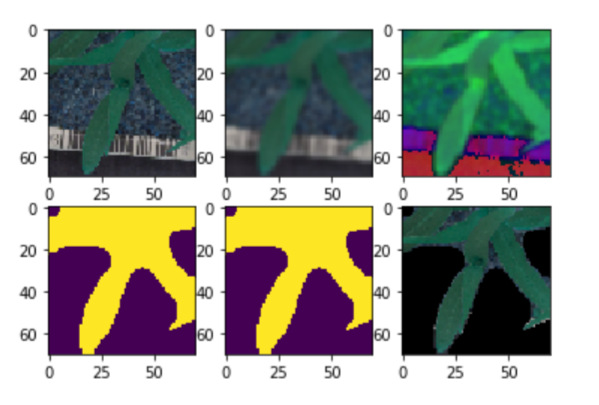
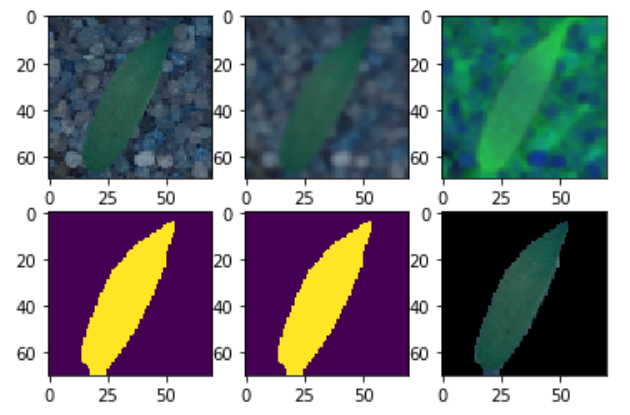
CLEANING THE IMAGES AND REMOVING THE BACKGROUND
It is a very important step to performing the cleaning. Cleaning an image is an intensive task. We will be performing the following steps in order to clean the images
- Convert the RGB images into the HSV
- In order to remove the noise, we will have to blur the images
- In order to remove the background, we will have to create a mask.
new_train = []
sets = []; getEx = True
for i in trainingset:
blurr = cv2.GaussianBlur(i,(5,5),0)
hsv = cv2.cvtColor(blurr,cv2.COLOR_BGR2HSV)
#GREEN PARAMETERS
lower = (25,40,50)
upper = (75,255,255)
mask = cv2.inRange(hsv,lower,upper)
struc = cv2.getStructuringElement(cv2.MORPH_ELLIPSE,(11,11))
mask = cv2.morphologyEx(mask,cv2.MORPH_CLOSE,struc)
boolean = mask>0
new = np.zeros_like(i,np.uint8)
new[boolean] = i[boolean]
new_train.append(new)
if getEx:
plt.subplot(2,3,1);plt.imshow(i) # ORIGINAL
plt.subplot(2,3,2);plt.imshow(blurr) # BLURRED
plt.subplot(2,3,3);plt.imshow(hsv) # HSV CONVERTED
plt.subplot(2,3,4);plt.imshow(mask) # MASKED
plt.subplot(2,3,5);plt.imshow(boolean) # BOOLEAN MASKED
plt.subplot(2,3,6);plt.imshow(new) # NEW PROCESSED IMAGE
plt.show()
getEx = False
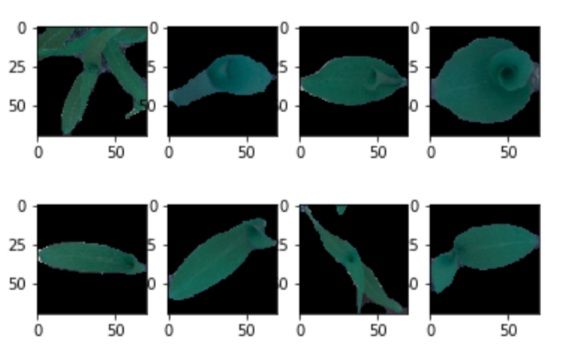
new_train = np.asarray(new_train)
# CLEANED IMAGES
for i in range(8):
plt.subplot(2,4,i+1)
plt.imshow(new_train[i])
CONVERTING THE LABELS INTO NUMBERS
- The labels are strings and these are hard to process. So we’ll convert these labels into a binary classification.
- The classification can be represented by an array of 12 numbers which will follow the condition:
- 0 if the species is not detected.
- 1 if the species is detected.
- Example: If Blackgrass is detected, the array will be = [1,0,0,0,0,0,0,0,0,0,0,0]
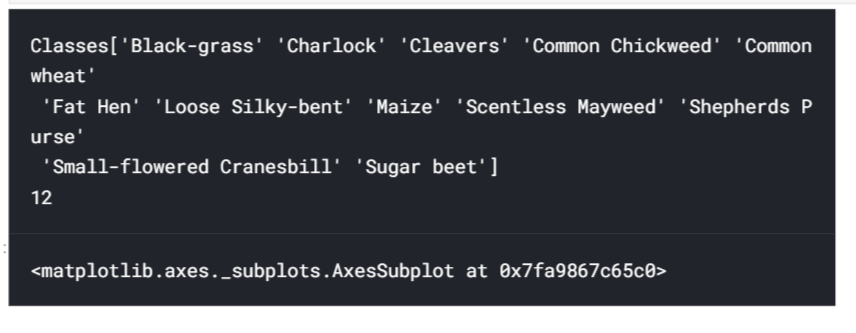
labels = preprocessing.LabelEncoder()
labels.fit(traininglabels[0])
print('Classes'+str(labels.classes_))
encodedlabels = labels.transform(traininglabels[0])
clearalllabels = np_utils.to_categorical(encodedlabels)
classes = clearalllabels.shape[1]
print(str(classes))
traininglabels[0].value_counts().plot(kind='pie')
DEFINING OUR MODEL AND SPLITTING THE DATASET
In this step, we are going to split the training dataset for validation. We are using the train_test_split() function from scikit-learn. Here we are splitting the dataset keeping the test_size=0.1. It means 10% of total data is used as testing data and the other 90% as training data. Check the below code for splitting the dataset.
new_train = new_train/255
x_train,x_test,y_train,y_test = train_test_split(new_train,clearalllabels,test_size=0.1,random_state=seed,stratify=clearalllabels)
PREVENTING OVERFITTING
Overfitting is a problem in machine learning in which our model performs very well on train g data but performs poorly on testing data.
The problem of overfitting is severe in deep learning where deep neural networks get overfitted. The problem of overfitting affects our end results badly.
To get rid of it, we need to reduce it. In this problem, we are using the ImageDataGenerator() function which randomly changes the characteristics of images and provides randomness in the data. To avoid overfitting, we need a function. This function randomly changes the image characteristics. Check the below code on how to reduce overfitting
generator = ImageDataGenerator(rotation_range = 180,zoom_range = 0.1,width_shift_range = 0.1,height_shift_range = 0.1,horizontal_flip = True,vertical_flip = True)
generator.fit(x_train)
DEFINING THE CONVOLUTIONAL NEURAL NETWORK
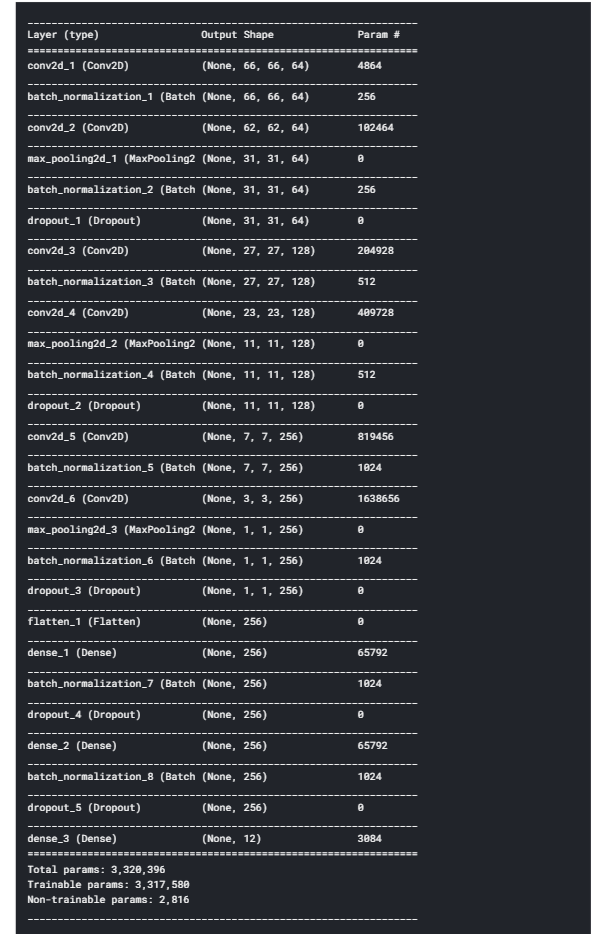
Our dataset consists of images so we can’t use machine learning algorithms like linear regression, logistic regression, decision trees, etc. We need a deep neural network for the images. In this problem, we are going to use a convolutional neural network. This neural network will take images as input and it will provide the final output as a species value. We are randomly using 4 convolution layers and 3 fully connected layers. Also, We are using multiple functions like Sequential(), Conv2D(), Batch Normalization, Max Pooling, Dropout, and Flatting.
We are using a convolutional neural network for training.
- This model has 4 convolution layers.
- This model has 3 fully connected layers.
np.random.seed(seed)
model = Sequential()
model.add(Conv2D(filters=64, kernel_size=(5, 5), input_shape=(scale, scale, 3), activation='relu'))
model.add(BatchNormalization(axis=3))
model.add(Conv2D(filters=64, kernel_size=(5, 5), activation='relu'))
model.add(MaxPooling2D((2, 2)))
model.add(BatchNormalization(axis=3))
model.add(Dropout(0.1))
model.add(Conv2D(filters=128, kernel_size=(5, 5), activation='relu'))
model.add(BatchNormalization(axis=3))
model.add(Conv2D(filters=128, kernel_size=(5, 5), activation='relu'))
model.add(MaxPooling2D((2, 2)))
model.add(BatchNormalization(axis=3))
model.add(Dropout(0.1))
model.add(Conv2D(filters=256, kernel_size=(5, 5), activation='relu'))
model.add(BatchNormalization(axis=3))
model.add(Conv2D(filters=256, kernel_size=(5, 5), activation='relu'))
model.add(MaxPooling2D((2, 2)))
model.add(BatchNormalization(axis=3))
model.add(Dropout(0.1))
model.add(Flatten())
model.add(Dense(256, activation='relu'))
model.add(BatchNormalization())
model.add(Dropout(0.5))
model.add(Dense(256, activation='relu'))
model.add(BatchNormalization())
model.add(Dropout(0.5))
model.add(Dense(classes, activation='softmax'))
model.compile(loss='categorical_crossentropy', optimizer='adam', metrics=['accuracy'])
model.summary()
FITTING THE CNN ONTO THE DATA
Next is to fit the CNN model onto our dataset so that model will get learn from the training dataset and weights get updated. This trained CNN model can be further used to get the final predictions on our testing dataset. There are some pre-requirements that we have to follow like reducing the learning rate, find the best weights for the model and save these calculated weights so that we can use them further for testing and getting predictions.
We need the following as per our general knowledge
- Best weights for the model
- Reduce learning rate
- Save the last weights of the model
lrr = ReduceLROnPlateau(monitor='val_acc',
patience=3,
verbose=1,
factor=0.4,
min_lr=0.00001)
filepath="drive/DataScience/PlantReco/weights.best_{epoch:02d}-{val_acc:.2f}.hdf5"
checkpoints = ModelCheckpoint(filepath, monitor='val_acc',
verbose=1, save_best_only=True, mode='max')
filepath="drive/DataScience/PlantReco/weights.last_auto4.hdf5"
checkpoints_full = ModelCheckpoint(filepath, monitor='val_acc',
verbose=1, save_best_only=False, mode='max')
callbacks_list = [checkpoints, lrr, checkpoints_full]
#MODEL
# hist = model.fit_generator(datagen.flow(trainX, trainY, batch_size=75),
# epochs=35, validation_data=(testX, testY),
# steps_per_epoch=trainX.shape[0], callbacks=callbacks_list)
# LOADING MODEL
model.load_weights("../input/plantrecomodels/weights.best_17-0.96.hdf5")
dataset = np.load("../input/plantrecomodels/Data.npz")
data = dict(zip(("x_train","x_test","y_train", "y_test"), (dataset[k] for k in dataset)))
x_train = data['x_train']
x_test = data['x_test']
y_train = data['y_train']
y_test = data['y_test']
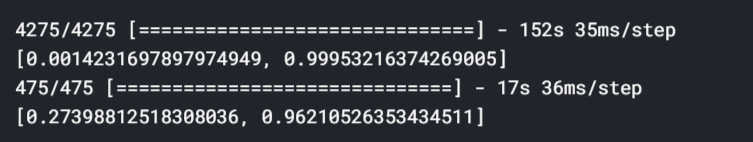
print(model.evaluate(x_train, y_train)) # Evaluate on train set
print(model.evaluate(x_test, y_test)) # Evaluate on test set
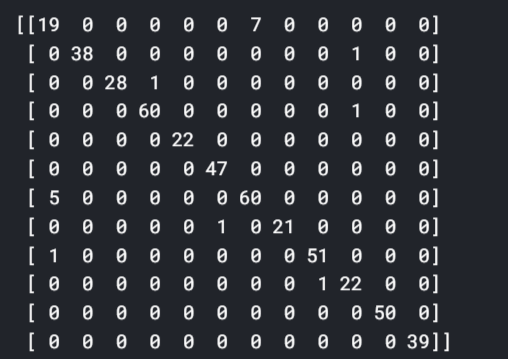
CONFUSION MATRIX
A confusion matrix is a way to check how our model performs on data. It is a good way to analyse the error in the model. Check the below code for the confusion matrix
# PREDICTIONS
y_pred = model.predict(x_test)
y_class = np.argmax(y_pred, axis = 1)
y_check = np.argmax(y_test, axis = 1)
cmatrix = confusion_matrix(y_check, y_class)
print(cmatrix)
GETTING PREDICTIONS
In the final part, we are getting our predictions on the testing dataset. Check the below code for getting the predictions using the trained model
path_to_test = '../input/plant-seedlings-classification/test/*.png'
pics = glob(path_to_test)
testimages = []
tests = []
count=1
num = len(pics)
for i in pics:
    print(str(count)+'/'+str(num),end='r')
    tests.append(i.split('/')[-1])
    testimages.append(cv2.resize(cv2.imread(i),(scale,scale)))
    count = count + 1
testimages = np.asarray(testimages)

newtestimages = []
sets = []
getEx = True
for i in testimages:
blurr = cv2.GaussianBlur(i,(5,5),0)
hsv = cv2.cvtColor(blurr,cv2.COLOR_BGR2HSV)
lower = (25,40,50)
upper = (75,255,255)
mask = cv2.inRange(hsv,lower,upper)
struc = cv2.getStructuringElement(cv2.MORPH_ELLIPSE,(11,11))
mask = cv2.morphologyEx(mask,cv2.MORPH_CLOSE,struc)
boolean = mask>0
masking = np.zeros_like(i,np.uint8)
masking[boolean] = i[boolean]
newtestimages.append(masking)
if getEx:
plt.subplot(2,3,1);plt.imshow(i)
plt.subplot(2,3,2);plt.imshow(blurr)
plt.subplot(2,3,3);plt.imshow(hsv)
plt.subplot(2,3,4);plt.imshow(mask)
plt.subplot(2,3,5);plt.imshow(boolean)
plt.subplot(2,3,6);plt.imshow(masking)
plt.show()
getEx=False
newtestimages = np.asarray(newtestimages)
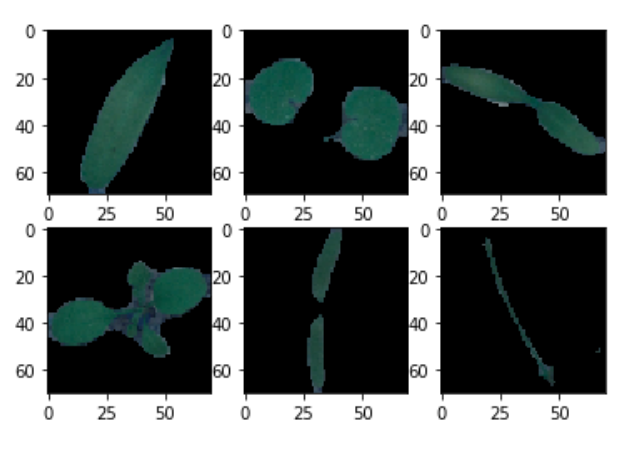
# OTHER MASKED IMAGES
for i in range(6):
plt.subplot(2,3,i+1)
plt.imshow(newtestimages[i])
Newtestimages=newtestimages/255
prediction = model.predict(newtestimages)
# PREDICTION TO A CSV FILE
pred = np.argmax(prediction,axis=1)
predStr = labels.classes_[pred]
result = {'file':tests,'species':predStr}
result = pd.DataFrame(result)
result.to_csv("Prediction.csv",index=False)
End Notes
So in this article, we had a detailed discussion on Plants Seedlings Classification Using CNN. Hope you learn something from this blog and it will help you in the future. Thanks for reading and your patience. Good luck!
You can check my articles here: Articles
Email id: [email protected]
Connect with me on LinkedIn: LinkedIn.
The media shown in this article are not owned by Analytics Vidhya and is used at the Author’s discretion.


Hi Akshay, I tried this Jupyter notebook for my learning purpose, However I have received an error on 3rd code IndexError Traceback (most recent call last) in 27 for i in range(8): 28 plt.subplot(2,4,i+1) ---> 29 plt.imshow(new_train[i]) IndexError: index 0 is out of bounds for axis 0 with size 0 Kindly help me get this solved for my learning
new_train = [] sets = []; getEx = True for i in trainingset: blurr = cv2.GaussianBlur(i,(5,5),0) hsv = cv2.cvtColor(blurr,cv2.COLOR_BGR2HSV) #GREEN PARAMETERS lower = (25,40,50) upper = (75,255,255) mask = cv2.inRange(hsv,lower,upper) struc = cv2.getStructuringElement(cv2.MORPH_ELLIPSE,(11,11)) mask = cv2.morphologyEx(mask,cv2.MORPH_CLOSE,struc) boolean = mask>0 new = np.zeros_like(i,np.uint8) new[boolean] = i[boolean] new_train.append(new) if getEx: plt.subplot(2,3,1);plt.imshow(i) # ORIGINAL plt.subplot(2,3,2);plt.imshow(blurr) # BLURRED plt.subplot(2,3,3);plt.imshow(hsv) # HSV CONVERTED plt.subplot(2,3,4);plt.imshow(mask) # MASKED plt.subplot(2,3,5);plt.imshow(boolean) # BOOLEAN MASKED plt.subplot(2,3,6);plt.imshow(new) # NEW PROCESSED IMAGE plt.show() getEx = False new_train = np.asarray(new_train) # CLEANED IMAGES for i in range(8): plt.subplot(2,4,i+1) plt.imshow(new_train[i]) IndexError Traceback (most recent call last) in () 27 for i in range(8): 28 plt.subplot(2,4,i+1) ---> 29 plt.imshow(new_train[i]) IndexError: index 0 is out of bounds for axis 0 with size 0 Kindly help this resolved
Hey sir, such a great post about plants you are doing a great wor.