Have you ever found yourself staring at a model evaluation tutorial from a data science course, trying hard to make sense of all the simple evaluation metrics definitions and formulas? Or perhaps you’ve found yourself constantly forgetting the very fundamental equations when you are preparing for your data scientist/NLP/AI engineer interviews?
I have been there. Most learning materials dive straight into formulas and mathematical definitions. Some are with beautiful visualizations, which is great for quick, cheatsheet reference during data pipeline implementation or interview prep. However, this approach often leaves us cramming these formulas as trivia flashcards, without understanding what they actually mean.
After reading this article, you will be able to:
- Build an intuitive understanding of evaluation metrics before diving into formulas
- Explain why overall accuracy can be misleading
- Connect complex metrics, like BLEU and ROUGE, to fundamental evaluation concepts
Whether you’re a data scientist just starting with NLP, part of a newly formed AI team, or simply looking for a clearer understanding of evaluation fundamentals, this article takes a different approach. Instead of focusing on the formulas, we will help you build your intuition one step at a time.
Table of contents
Start with The “Naive” Question
Imagine you were given a dataset with 100 outputs from a language model, along with a perfect ground truth dataset (containing truthful reference outputs). You’re asked to evaluate it. First question that comes to your mind:
“How good is the model?”
That’s a good question, and this can be even better if we break down what “good” actually means in concrete terms.
Overall Accuracy
The most intuitive answer might be: “The model should get all things right. More correct outputs = better model, fewer errors = better performance.” If we assume exact matches with our ground truth, this gives us:
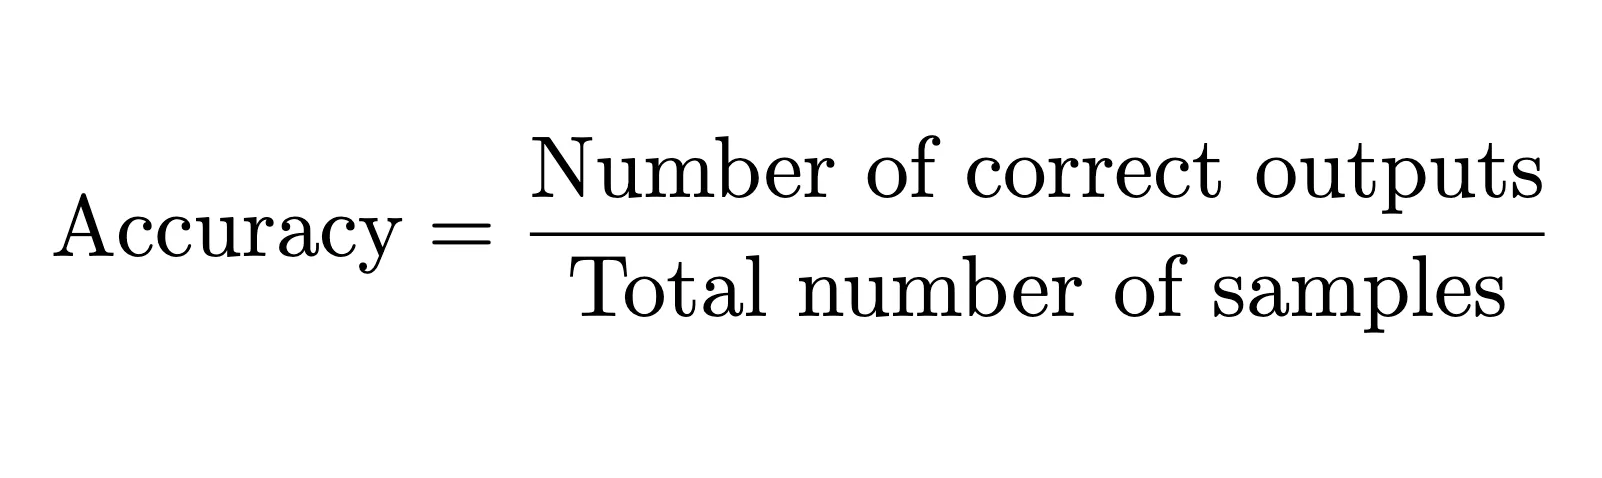
Getting 100% accuracy would be too ideal, and in the real world, models make mistakes.
However, a model can still be excellent even with seemingly poor overall accuracy.
Real-World Scenario: Hate Speech Detection
Let’s add some background information to your dataset. Imagine we’re in the process of building a system to detect hate speech in Reddit comments. Our system will focus on catching negative (hateful) content, rather than perfectly classifying positive or neutral comments, based on our model outputs.
Here’s a sample of what we might see:
| Sample | 1 | 2 | 3 | 4 | 5 | 6 | 7 | 8 | 9 | 10 |
|---|---|---|---|---|---|---|---|---|---|---|
| Ground truth | negative | positive | neutral | neutral | neutral | positive | negative | positive | neutral | neutral |
| Model output | negative | neutral | positive | positive | positive | neutral | negative | neutral | positive | positive |
Overall accuracy: 2/10 = 20%
If you judge by the score, it looks terrible. But if you take a closer look at the table, the model successfully identified all the 2 instances of hate speech, which is exactly what we care about for this application. While it completely failed to distinguish between neutral and positive comments, it’s catching all the cases that matter most.
This suggests we need a more focused evaluation approach. Instead of looking at overall accuracy, let’s focus on the specific output we care about. That leads to our first supporting question:
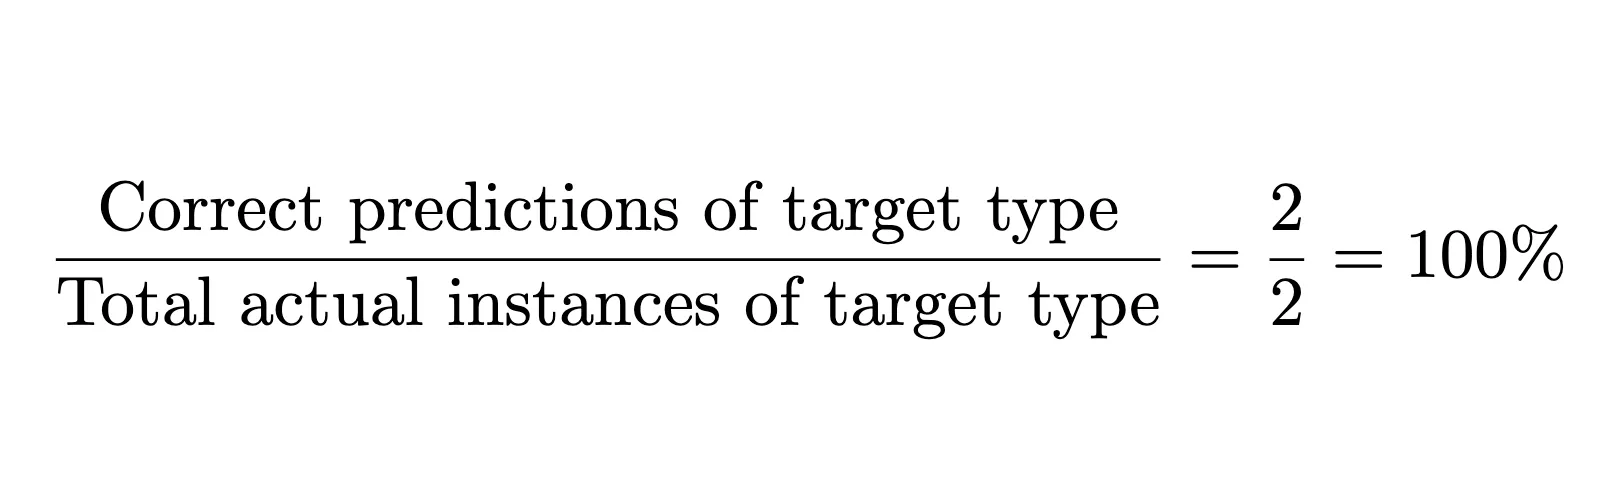
“Did the model catch everything we care about?”
Out of all the hate speech in our dataset, what fraction did the model successfully identify?
Is the Metric Good Enough?
Now, let’s compare two different models on the same task:
| Sample | 1 | 2 | 3 | 4 | 5 | 6 | 7 | 8 | 9 | 10 |
|---|---|---|---|---|---|---|---|---|---|---|
| Ground truth | negative | positive | neutral | neutral | neutral | positive | negative | positive | neutral | neutral |
| Model 1 output | negative | neutral | positive | positive | positive | neutral | negative | neutral | positive | positive |
| Model 2 output | negative | negative | negative | positive | negative | neutral | negative | neutral | positive | positive |
Using our “catch everything we care about” metric from above:
Model 1: 2/2 = 100% Model 2: 2/2 = 100%
Both models score perfectly- but wait! This doesn’t tell the whole story. Model 2 is flagging many non-hateful comments as hate speech—a serious problem that would frustrate users. That brings us to our next supporting question:
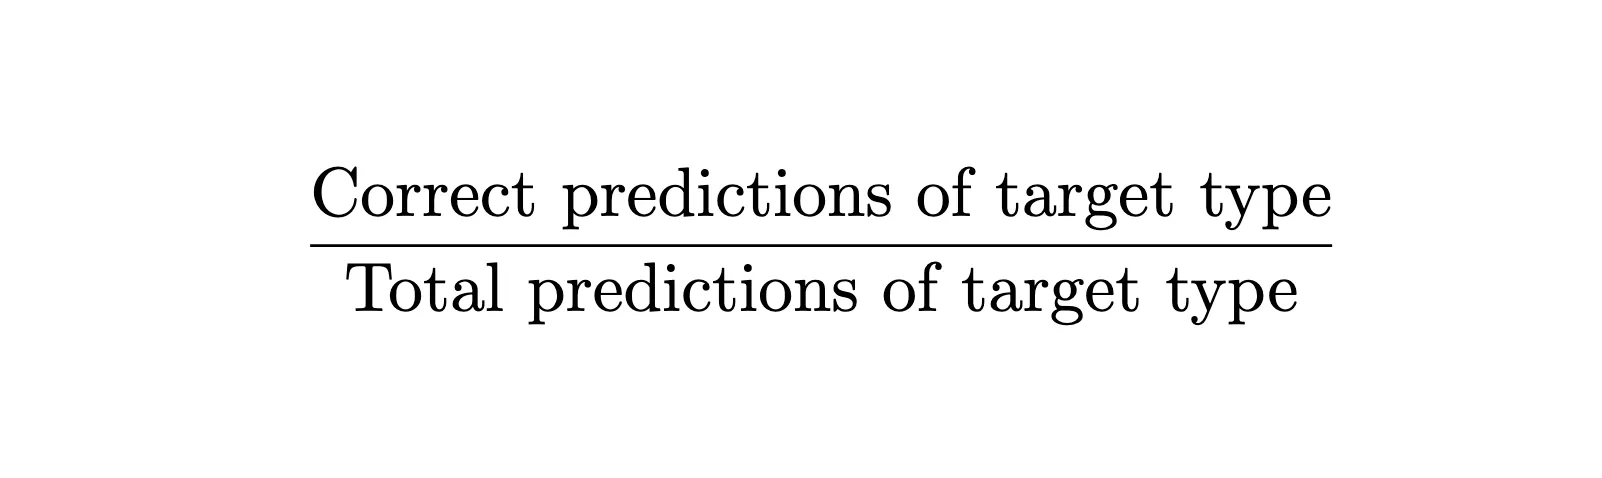
“When the model flags an output that we care about, is it a correct output?”
Out of all the hate speech predictions our model made, what fraction were actually correct?
Let’s calculate for both models:
Model 1: 2/2 = 100% Model 2: 2/5 = 40%
As we can see, Model 1 performs much better than Model 2, since it doesn’t generate any false alarms for hate speech detection.
Can This Replace Our First Metric?
Let’s test this with a third model:
| Sample | 1 | 2 | 3 | 4 | 5 | 6 | 7 | 8 | 9 | 10 |
|---|---|---|---|---|---|---|---|---|---|---|
| Ground truth | negative | positive | neutral | neutral | neutral | positive | negative | positive | neutral | neutral |
| Model 1 output | negative | neutral | positive | positive | positive | neutral | negative | neutral | positive | positive |
| Model 3 output | negative | neutral | positive | positive | positive | neutral | positive | neutral | positive | positive |
Model 1: 2/2 = 100% Model 3: 1/1 = 100%
Both models score perfectly on our second metric, but we can learn from the dataset that Model 3 only caught half of the actual hate speech in our dataset.
This tells us both metrics matter—we need models that can catch all the reference cases we care about, yet all the outputs of that type are correct.
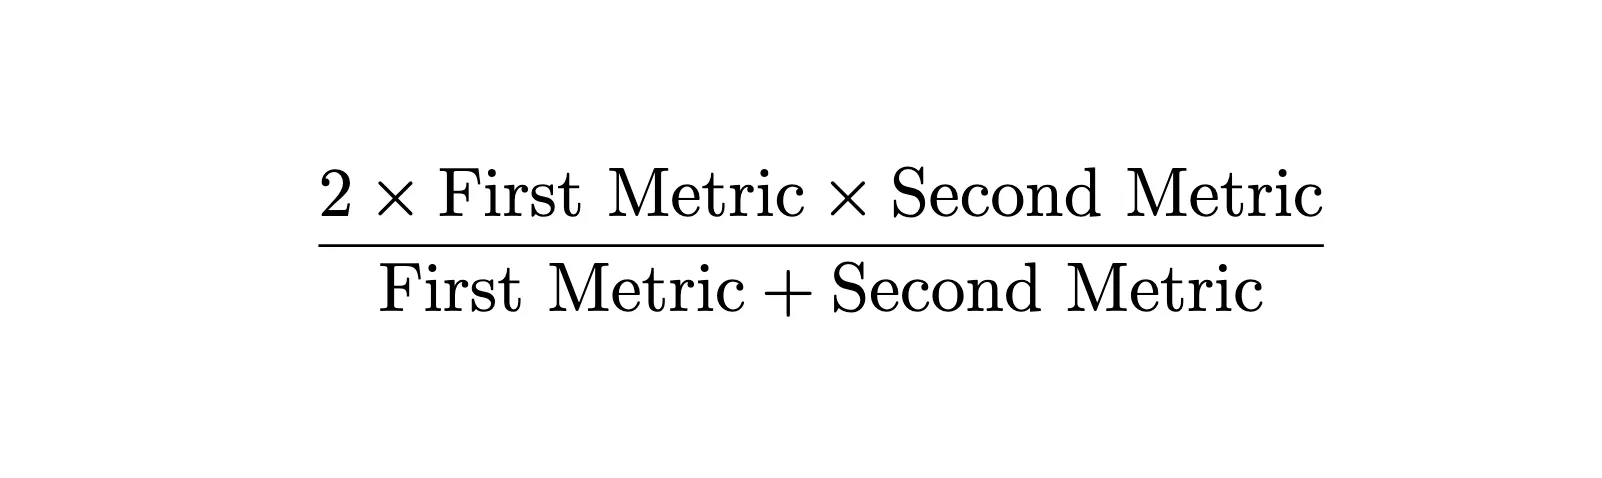
In practice, it’s rare for a model to achieve 100% on both metrics, and we want a single metric that balances both concerns. Since both metrics are rates (fractions), we use the harmonic mean rather than the arithmetic mean to combine them.
The harmonic mean gives equal weight to both metrics and is sensitive to low values—if either metric is poor, the combined score will be poor:
Bringing Them Together
Now that we’ve built intuition for these concepts, let’s connect them to their historical origins:
The first metric type is categorized as Recall, and the second metric type is categorized as Precision. Both were first coined by Cyril Cleverdon in the 1960s during the Cranfield information-retrieval experiments.
He needed ways to quantify how well document retrieval systems performed: recall measured “completeness” (did we find all the relevant documents?), while precision measured the “exactness” of retrieved documents (were the retrieved documents actually relevant?),
The combined harmonic mean, which is called the F1 Score, comes from the F_β effectiveness function defined by C. J. van Rijsbergen. The “F1” is simply the case where β = 1, giving equal weight to precision and recall. This metric was later popularized by the 1992 MUC-4 evaluation conference and became standard.
When Exact Matches Aren’t Enough
Our hate speech example is a classification problem, and we validate output via exact match. But many NLP tasks involve more nuanced evaluation where exact matches don’t capture the full picture.
Consider these scenarios:
- Machine Translation: “The cat sat on the mat” vs “A cat was sitting on the mat” – different words, similar meaning
- Text Summarization: There are many different ways to summarize the same document
- Information Retrieval: Output is a ranked list of documents, not a single item
For these tasks, we can’t simply use a binary method (i.e., true/false) when we validate model outputs. Good translations can use different words, as well as good summaries, and the search result list may not be considered a failure if only the last 2 items in the list were ranked differently.
This means our evaluation formulas have to evolve and mutate to fit these more complex scenarios. Let’s explore a few examples:
Information Retrieval: Evaluating Ranked Lists
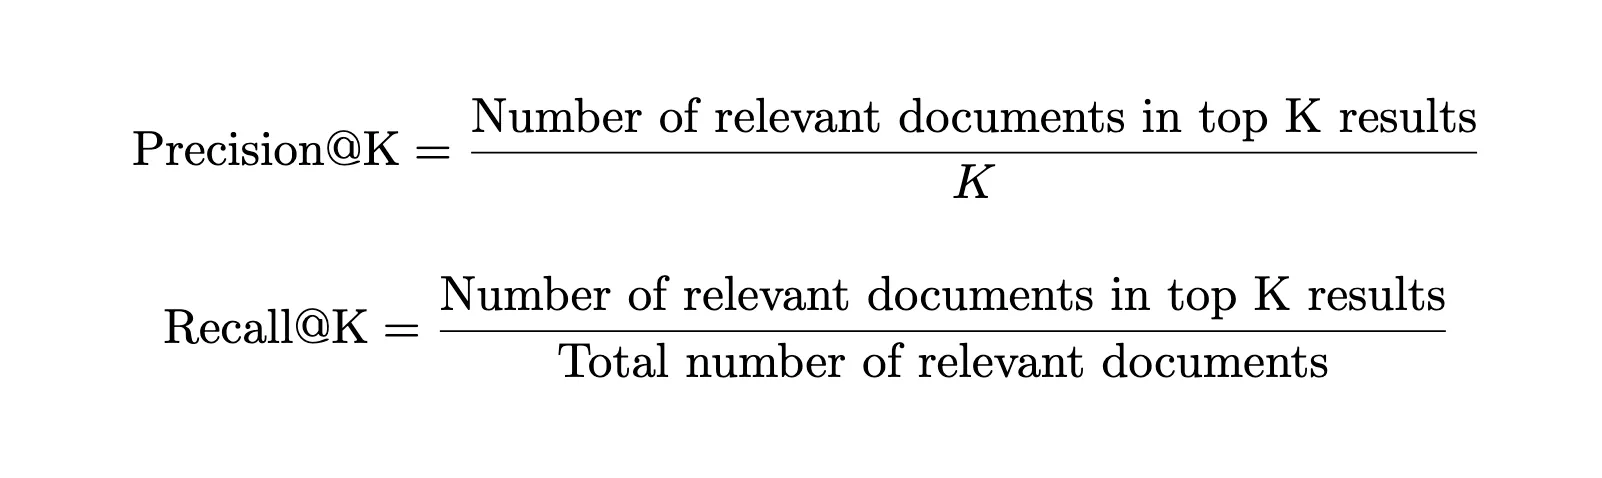
As we mentioned, we’re not evaluating a single prediction—we’re evaluating an entire ranked list. Both our fundamental questions should apply, with a twist – “Out of all the relevant documents, how many appear in the top K results?” and “Out of the first K results, how many are actually relevant?”.
Example: Searching for “machine learning papers”
- Top 10 results: 7 are actually about ML, 3 are irrelevant
- Total relevant papers in database: 100 papers total
- First metric @10: 7/100 = 7% (we’re only catching 7% of all the machine learning papers)
- Second metric @10: 7/10 = 70% (when we show a top 10 result, we’re right 70% of the time)
This is the same thinking as our hate speech detection. The “@10” part just acknowledges that users typically only look at the first page of results:
Translation Tasks: BLEU Score
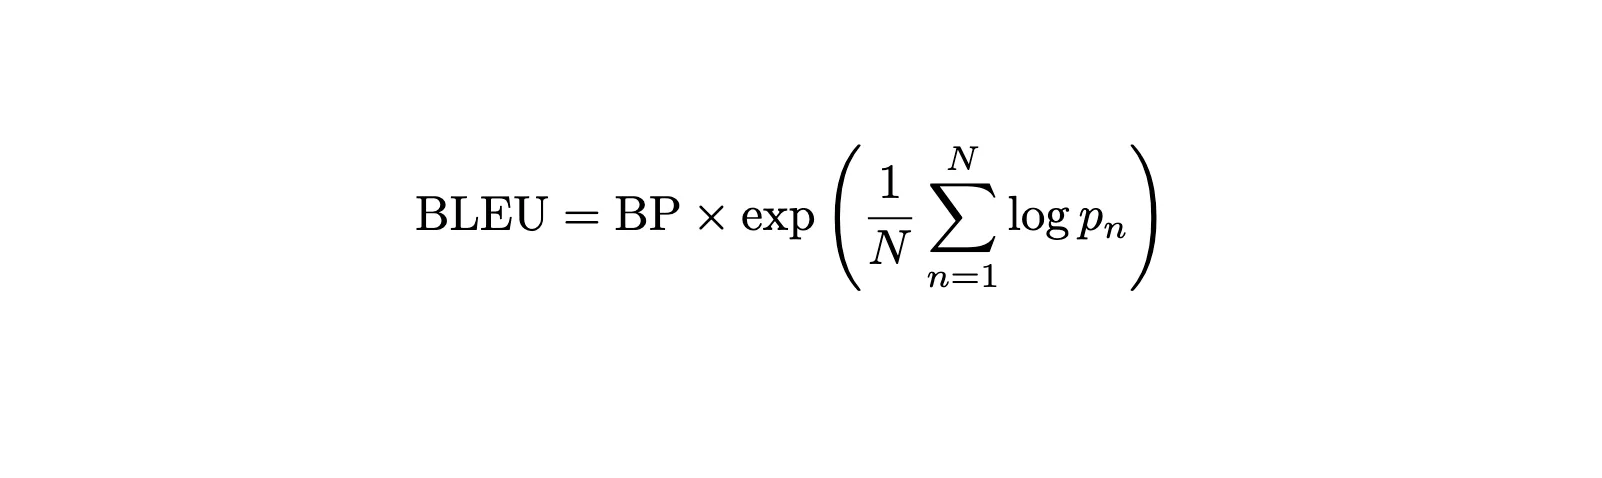
Remember our second supporting question – “When the model flags an output that we care about, is it a correct output?” For translation, this becomes: “When our model produces words, how many have a similar meaning to the reference translation?”
BLEU applies our second metric’s thinking to translation by asking: “What fraction of the words and phrases in our translation actually appear in the reference?”
Example:
- Reference: “The cat sat on the mat”
- Model output: “A cat was sitting on the mat”
- Word-level matches: cat, on, the, mat all appear in reference (4 out of 6 model words = 67%)
- Phrase-level matches: “on the”, “the mat” both appear in reference (2 out of 5 possible phrases = 40%)
BLEU builds upon the concept of precision by checking matches at both word and phrase levels—just like how we checked individual predictions in our hate speech example, but now applied to the translation domain:
Summarization Tasks: ROUGE Score
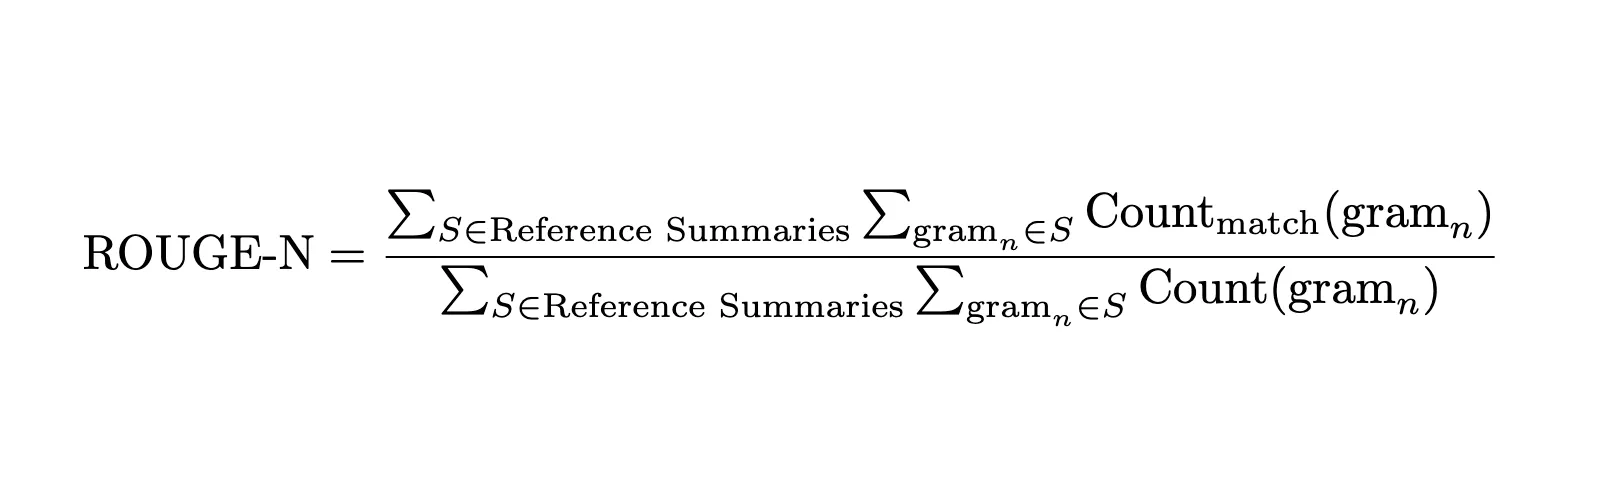
Back to our first supporting question- “Did the model catch everything we care about?” For summarization, this becomes: “Did our summary capture the key information from the reference?”
ROUGE applies our first metric’s thinking to summaries, by asking: “What fraction of the important words and concepts from the reference summary appear in our model’s summary?”
Example:
- Reference: “The study shows exercise improves mental health”
- Model output: “Exercise helps mental health according to research”
- Word-level coverage: exercise, mental, health appear in model summary (3 out of 7 reference words = 43%)
- Concept coverage: The core idea “exercise improves mental health” is captured, even with different wording
ROUGE focuses on our first metric because a good summary should capture the essential information from the reference. The exact wording matters less than covering the key points.
Note: There are different variations of BLEU, ROUGE, and @K formula, and we will not go through all the variations and notations here since it will be out of our learning objectives and may introduce more confusion.
Read more: Evaluation Metrics or Classification Models
Conclusion
Understanding evaluation metrics doesn’t have to start with memorizing definitions and formulas. By building intuition through practical scenarios, we can see why different metrics exist and when to use them. For example, A fraud detection system (recall-focused) needs a different evaluation than a spam filter (precision-focused).
The next time you encounter an unfamiliar evaluation metric, try asking: What aspect of model performance is this trying to capture? What real-world problem was it designed to solve?
In our next exploration, we’ll dive into evaluation strategies including similarity-based approaches, alternative judging methods, and frameworks for handling contexts where “correct” is inherently pluralistic.
Any questions? connect with me here
Frequently Asked Questions
Q1. Why is overall accuracy not always a good metric?
A. Accuracy treats all outputs equally. In tasks like hate speech detection, we care more about catching harmful content than perfectly classifying neutral or positive comments, so accuracy alone can be misleading.
Q2. What does recall measure?
A. Recall answers: “Did we catch everything we care about?” It’s the fraction of all relevant items correctly identified by the model, like finding all hate speech comments in a dataset.
Q3. What does precision measure?
A. Precision answers: “When the model flags something, is it right?” It’s the fraction of flagged items that are correct, reducing false alarms and improving user trust.
Q4. What is the F1 score?
A. F1 combines precision and recall using the harmonic mean, balancing completeness and correctness. A low value in either metric pulls the F1 down, making it a good single measure of both.
Q5. How do BLEU and ROUGE fit in?
A. BLEU focuses on precision for translations (how many generated words match references), while ROUGE focuses on recall for summaries (how much reference content is covered). Both adapt core metrics to more complex NLP outputs.
AI product builder and independent researcher specializing in conversational AI, NLP, and the evaluation and reliability of ML/AI systems.
Master of Applied Data Science @ University of Michigan.
Designed and deployed production conversational AI—enterprise chatbots and LLM-powered assistants—bridging research with product constraints. His current interests include rubric-guided human evaluation, optimizing retrieval for RAG and agentic workflows, and taking AI from prototype to production with clear, honest metrics. He also published the Traditional Chinese edition of O’Reilly’s Designing Machine Learning Systems. Contact: [email protected] · arthurcho.notion.site


