Ever felt lost in messy folders, so many scripts, and unorganized code? That chaos only slows you down and hardens the data science journey. Organized workflows and project structures are not just nice-to-have, because it affects the reproducibility, collaboration and understanding of what’s happening in the project. In this blog, we’ll explore the best practices plus look at a sample project to guide your forthcoming projects. Without any further ado let’s look into some of the important frameworks, common practices, how to improve them.
Table of contents
Popular Data Science Workflow Frameworks for Project Structure
Data science frameworks provide a structured way to define and maintain a clear data science project structure, guiding teams from problem definition to deployment while improving reproducibility and collaboration.
CRISP-DM
CRISP-DM is the acronym for Cross-Industry Process for Data Mining. It follows a cyclic iterative structure including:
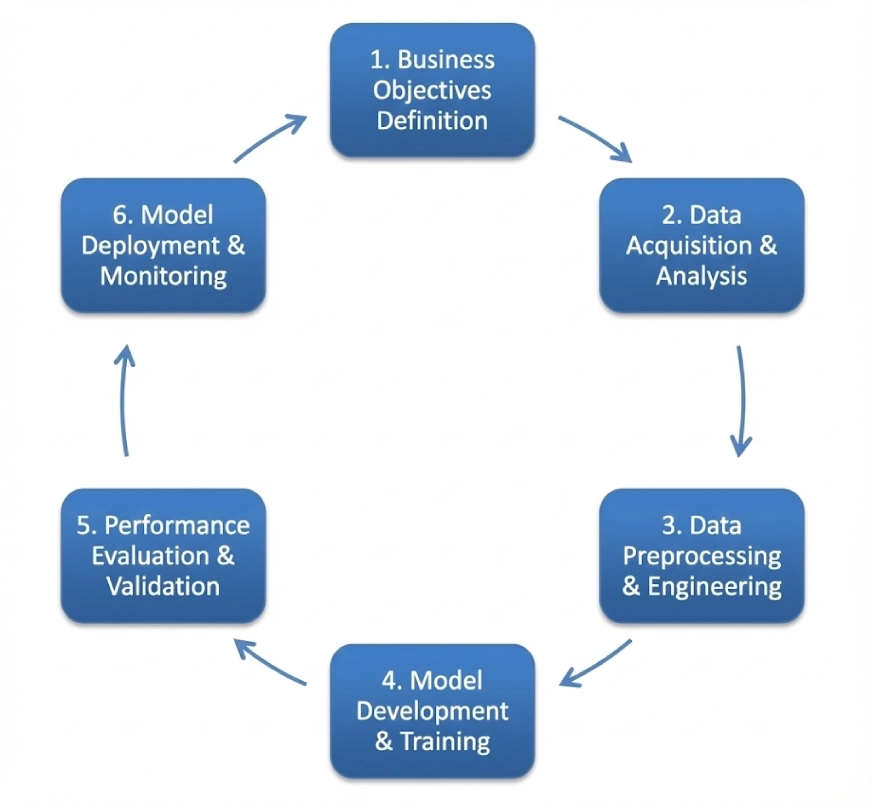
- Business Understanding
- Data Understanding
- Data Preparation
- Modeling
- Evaluation
- Deployment
This framework can be used as a standard across multiple domains, though the order of steps of it can be flexible and you can move back as well as opposed to the unidirectional flow. We’ll look at a project using this framework later on in this blog.
OSEMN
Another popular framework in the world of data science. The idea here is to break the complex problems into 5 steps and solve them step-by-step, the 5 steps of OSEMN (pronounced as Awesome) are:
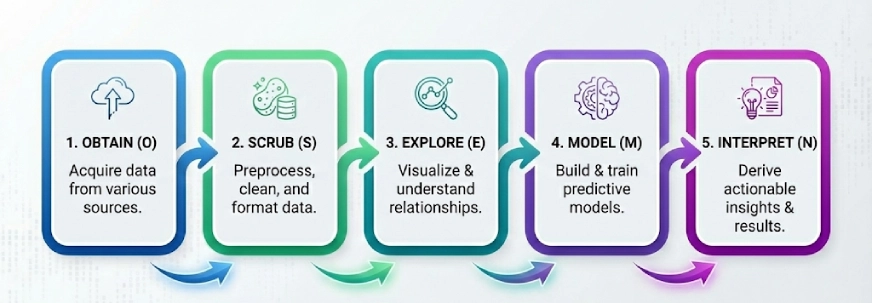
- Obtain
- Scrub
- Explore
- Model
- Interpret
Note: The ‘N’ in “OSEMN” is the N in iNterpret.
We follow these 5 logical steps to “Obtain” the data, “Scrub” or preprocess the data, then “Explore” the data by using visualizations and understanding the relationships between the data, and then we “Model” the data to use the inputs to predict the outputs. Finally, we “Interpret” the results and find actionable insights.
KDD
KDD or Knowledge Discovery in Databases consists of multiple processes that aim to turn raw data into knowledge discovery. Here are the steps in this framework:

- Selection
- Pre-Processing
- Transformation
- Data Mining
- Interpretation/Evaluation
It’s worth mentioning that people refer to KDD as Data Mining, but Data Mining is the specific step where algorithms are used to find patterns. Whereas, KDD covers the entire lifecycle from the start to end.
SEMMA
This framework emphasises more on the model development. The SEMMA comes from the logical steps in the framework which are:
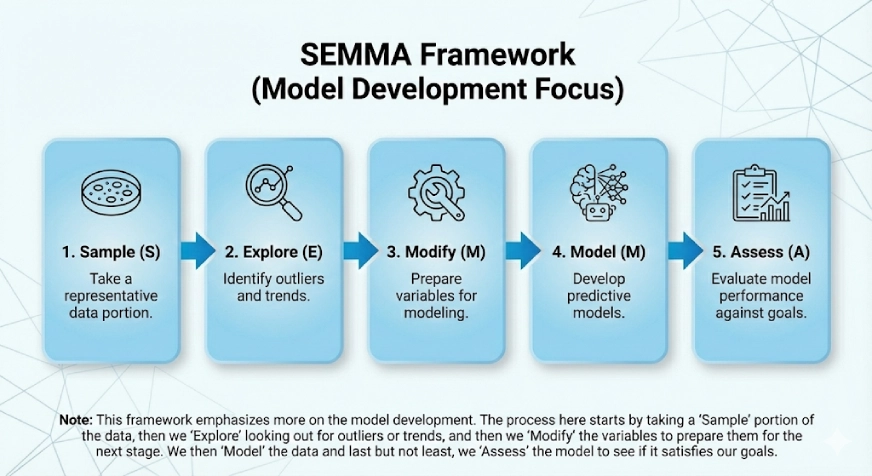
- Sample
- Explore
- Modify
- Model
- Assess
The process here starts by taking a “Sample” portion of the data, then we “Explore” looking out for outliers or trends, and then we “Modify” the variables to prepare them for the next stage. We then “Model” the data and last but not least, we “Assess” the model to see if it satisfies our goals.
Common Practices that Need to be Improved
Improving these practices is critical for maintaining a clean and scalable data science project structure, especially as projects grow in size and complexity.
1. The problem with “Paths”
People often hardcode absolute paths like pd.read_csv(“C:/Users/Name/Downloads/data.csv”). This is fine while testing things out on Jupyter Notebook but when used in the actual project it breaks the code for everyone else.
The Fix: Always use relative paths with the help of libraries like “os” or “pathlib”. Alternatively, you can choose to add the paths in a config file (for instance: DATA_DIR=/home/ubuntu/path).
2. The Cluttered Jupyter Notebook
Sometimes people use a single Jupyter Notebook with 100+ cells containing imports, EDA, cleaning, modeling, and visualization. This would make it impossible to test or version control.
The Fix: Use Jupyter Notebooks only for Exploration and stick to Python Scripts for Automation. Once a cleaning function works, add it to a src/processing.py file and then you can import it into the notebook. This adds modularity and re-usability and also makes testing and understanding the notebook a lot simpler.
3. Version the Code not the Data
Git can struggle in handling large CSV files. People out there often push data to GitHub which can take a lot of time and also cause other complications.
The Fix: Mention and use Data Version Control (DVC in short). It’s like Git but for data.
4. Not providing a README for the project
A repository can contain great code but without instructions on how to install dependencies or run the scripts can be chaotic.
The Fix: Ensure that you always craft a good README.md that has information on How to set up the environment, Where and how to get the data, How to run the model and other important scripts.
Building a Customer Churn Prediction System [Sample Project]
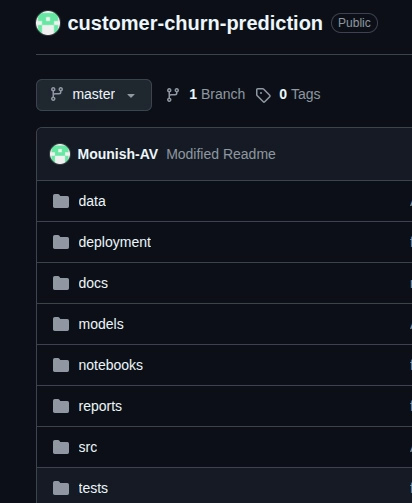
Now using the CRISP-DM framework I’ve created a sample project called “Customer Churn Prediction System”, let’s understand the whole process and the steps by taking a better look at the same.
Here’s the GitHub link of the repository.
Note: This is a sample project and is crafted to understand how to implement the framework and follow a standard procedure.
Applying CRISP-DM Step by Step
- Business Understanding: Here we have to define what we’re actually trying to solve. In our case it’s spotting customers who are likely to churn. We set clear targets for the system, 85%+ accuracy and 80%+ recall, and the business goal here is to retain the customers.
- Data Understanding In our case the Telco Customer Churn dataset. We have to look into the descriptive statistics, check the data quality, look for missing values (also think about how we can handle them), also we have to see how the target variable is distributed, also lastly we need to explore the correlations between the variables to see what features matter.
- Data Preparation: This step can take time but needs to be done carefully. Here we cleanse the messy data, deal with the missing values and outliers, create new features if required, encode the categorical variables, split the dataset into training (70%), validation (15%), and test (15%), and finally normalizing the features for our models.
- Modeling: In this crucial step, we start with a simple model or baseline (logistic regression in our case), then experiment with other models like Random Forest, XGBoost to achieve our business goals. We then tune the hyperparameters.
- Evaluation: Here we figure out which model is working the best for us and is meeting our business goals. In our case we need to look at the precision, recall, F1-scores, ROC-AUC curves and the confusion matrix. This step helps us pick the final model for our goal.
- Deployment: This is where we actually start using the model. Here we can use FastAPI or any other alternatives, containerize it with Docker for scalability, and set-up monitoring for track purposes.
Clearly using a step-by-step process helps provide a clear path to the project, also during the project development you can make use of progress trackers and GitHub’s version controls can surely help. Data Preparation needs intricate care as it won’t need many revisions if rightly done, if any issue arises after deployment it can be fixed by going back to the modeling phase.
Conclusion
As mentioned in the start of the blog, organized workflows and project structures are not just nice-to-have, they are a must. With CRISP-DM, OSEMN, KDD, or SEMMA, a step-by-step process keeps projects clear and reproducible. Also don’t forget to use relative paths, keep Jupyter Notebooks for Exploration, and always craft a good README.md. Always remember that development is an iterative process and having a clear structured framework to your projects will ease your journey.
Frequently Asked Questions
Q1. What is reproducibility in data science?
A. Reproducibility in data science means being able to obtain the same results using the same dataset, code, and configuration settings. A reproducible project ensures that experiments can be verified, debugged, and improved over time. It also makes collaboration easier, as other team members can run the project without inconsistencies caused by environment or data differences.
Q2. What is model drift?
A. Model drift occurs when a machine learning model’s performance degrades because real-world data changes over time. This can happen due to changes in user behavior, market conditions, or data distributions. Monitoring for model drift is essential in production systems to ensure models remain accurate, reliable, and aligned with business objectives.
Q3. Why should you use a virtual environment in data science projects?
A. A virtual environment isolates project dependencies and prevents conflicts between different library versions. Since data science projects often rely on specific versions of Python packages, using virtual environments ensures consistent results across machines and over time. This is critical for reproducibility, deployment, and collaboration in real-world data science workflows.
Q4. What is a data pipeline?
A. A data pipeline is a series of automated steps that move data from raw sources to a model-ready format. It typically includes data ingestion, cleaning, transformation, and storage.
Passionate about technology and innovation, a graduate of Vellore Institute of Technology. Currently working as a Data Science Trainee, focusing on Data Science. Deeply interested in Deep Learning and Generative AI, eager to explore cutting-edge techniques to solve complex problems and create impactful solutions.


