This article was published as a part of the Data Science Blogathon.
“Don`t jump into modeling. First, understand and explore your data!”
Overview
This is common advice for many data scientists. If your data set is messy, building models will not help you to solve your problem. What will happen is “garbage in, garbage out.” In order to build a powerful machine learning algorithm. We need to explore and understand our data set before we define a predictive task and solve it.
Data analysis is a nuanced discipline, and there are enough ways to slice and dice data to make a beginner’s head spin. A common question data analysts hear is “where do I even start with my analysis?” These are some hints to help start you on the right path thinking about a methodical way to uncover the answers in your data.
Introduction
Before going further, Data scientists spend most of their time exploring, cleaning, and preparing their data for modeling. This helps them to build accurate models and check assumptions required for fitting models.
Create meaningful data visualizations, predict future trends from the data.
If you are good at understanding data preparation almost 80% of the work is completed.
Table of Contents
- Ask the right questions?
- Analyze different subsets of data
- Explore trends
- Find your blind spots
- Investigate the whys
Ask the right questions
Whether it’s surveying results, sales data, or an email campaign, you’ve collected data for a specific purpose. By extension, apply this purpose to the questions you’re asking of the data itself. Beginning with some specific questions can keep your research focused and allow you to see the forest through the trees. A question like “what does my revenue look like for the past 3 years” is vague and allows for exploration but also confusion.
Instead, something like “which channel brings in the most revenue for the past 3 years” has a clearer answer. Subsequent questions may be: “which department brings in the most revenue per year” or “are sales in climbing gear increasing or decreasing this year?” It’s important to have a specific question in mind when you begin data analysis so as to provide some structure and avoid stumbling into false positives.
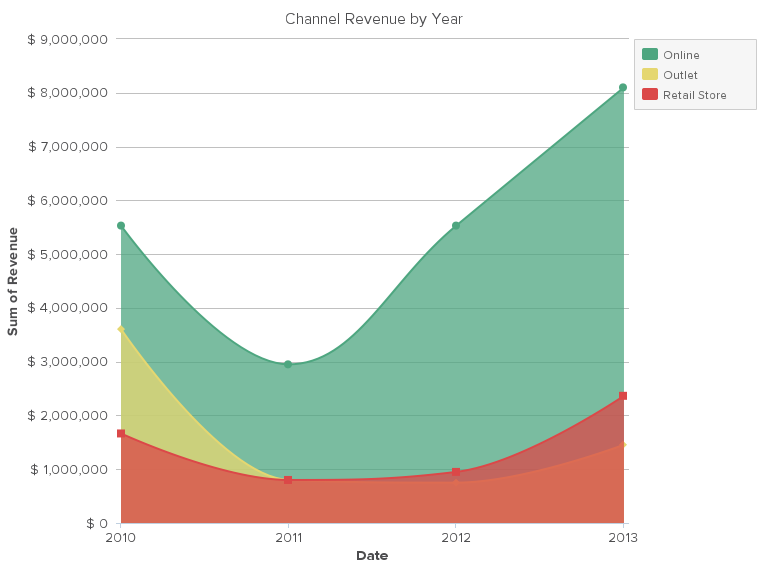
Analyze different subset of data:
It’s easier to spot relationships if you analyze the data from different subsets. For example, segment your revenue data by channel like the chart above, or by the department. Experiment with the subsets and variables that make the most sense of the questions you developed in the previous step.
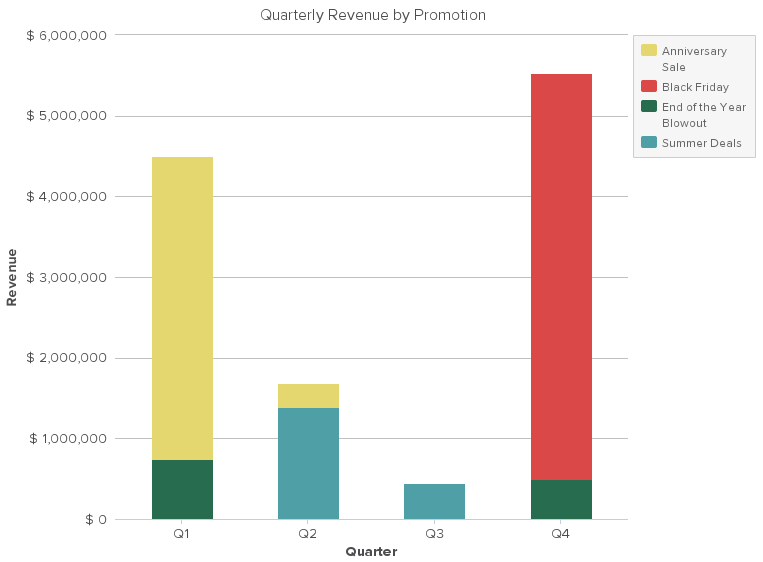
This design focuses on allowing you to stay within your train of thought and smoothly transition from question to question, without tripping up on formatting or equations. It can also be helpful to use what would be referred to as a pivot table in Excel. In our outdoor gear retailer example, you can switch from a quarterly view to revenue by a quarter of the year just by selecting in a drop-down menu. The graph below then is an aggregate of each quarter’s revenue between 2010 and 2013.
Explore trends
Experiment with your time variables. Look at the quarter, month, or week, whichever makes sense based on what you’re looking for. Sometimes what is missing is also just as important as what is there. If there are holes in your data analysis, take note. It can be helpful to take notes through your analysis, reminders of what you’d like to research or discuss with colleagues later.
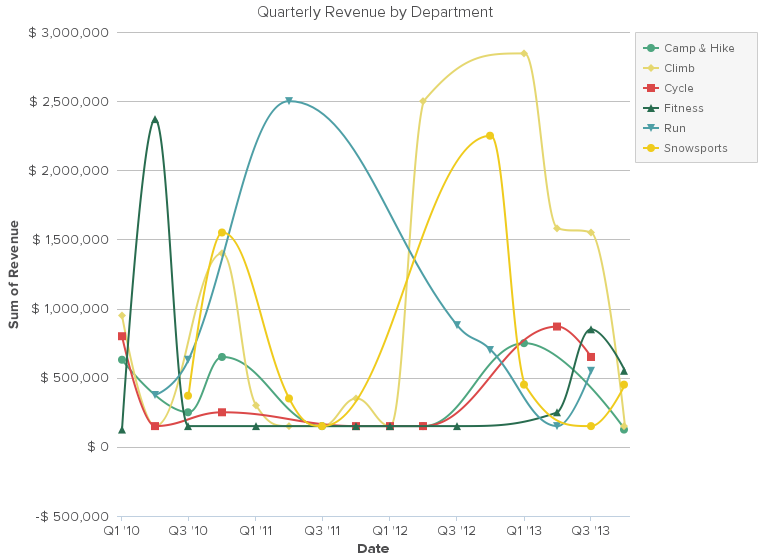
Take a look at this quarterly analysis of revenue by the department. It’s not very helpful because it’s hard to spot trends.
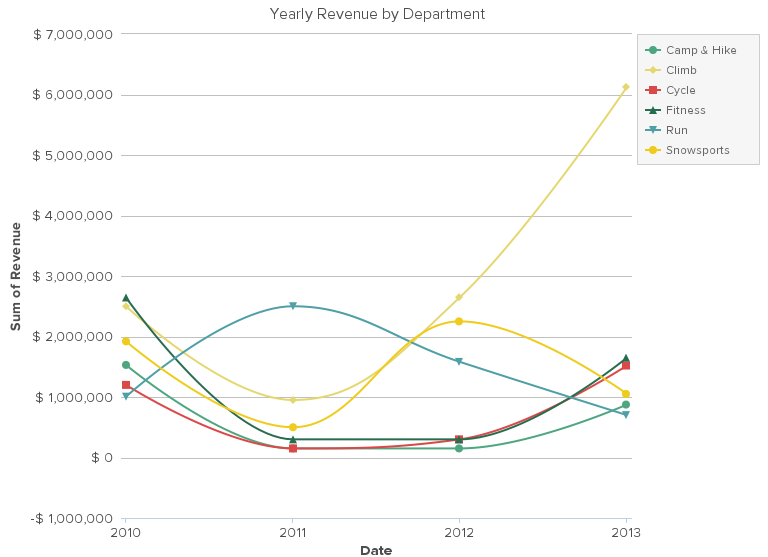
This yearly line graph makes it much easier to see that Climbing is the fastest-growing department and Running sales have been decreasing for the past three years.
Find your blind spots
Do you bump up against a particular question regularly? There is a fine line between collecting as much data as you can get answers, and frustrating your users with too many questions. Weigh this consideration when deciding how much data you’d like to collect. Then you can either find a way to gather that information from your users or at least write it on a data collection wish list for later discussion.
- Actually been collected
for the task you are being asked to do. And you are being asked to make the
data validate an outcome that has already been decided. - Most organizations don’t think scientifically. They don’t create a hypothesis and then decide what data they need to collect to validate it. They choose an outcome, then make the data fit.
- Often the data come from something else entirely – often as a byproduct of a business process. Then someone has the bright idea “We could use this to work out”
-
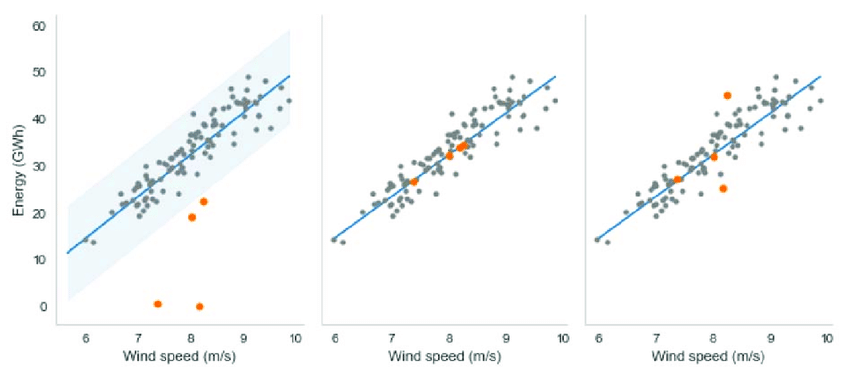
Analyzing the below graph, the graph illustrates the information about the blind spots of a data set. Hidden data will be one of the drawbacks to getting a solution. Overall, finding outliers will be a solution.
- Outlier correction based on the R parameter. The leftmost graph shows the original data with detected outliers. The middle graph uses a noise value of zero to place, or correct, the location of the outliers in the linear model. The rightmost graph places the outlier near the linear model at a distance based on a positive value for R (R = 0.5).
-
Investigate the whys:
After your daily, weekly, or quarterly analysis, take your charts, notes, and conclusions to the rest of the team and start trying to piece together as much as you can. The data can tell you what is happening, but not the why. The why requires piecing together the backstory. Because so many factors play into your sales data, coming together with your team to discuss insights from your data can lead to a lot more understanding. The marketing manager may know something about the third quarter’s climbing gear sales that the business analyst didn’t.
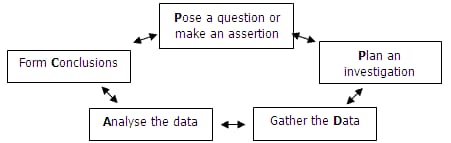
Data analysis is a continual process and the best way to approach it is to try to get less and less wrong. You probably won’t ever have all the data you want or need to answer every question about your business, but you can at least push toward more answers and better decisions. This continual feedback loop (question, analyze, investigate, repeat) can be improved but will never be perfect.
Endnotes
Understanding and interpreting data are a very crucial step in machine learning. In this blog post, we tried to provide an overview of techniques that can help you to better know your data
Depending on the size, dimension, and type of your data, you can choose the algorithm. For instance, when you have big raw data, you can use representative examples instead of random samples. If you have a wide data set, you can also find the important dimensions to understand the representative samples.
Different techniques can give you different insights on your data. It is your job to use the tools to solve the mystery like a detective.


