This article was published as a part of the Data Science Blogathon.
Topics to be covered
- What is Shapash library
- The objective of Shapash library
- Features of Shapash library
- How does Shapash Work
- Installation
- Getting Started
- Conclusion

What is Shapash library?
Model interpretability and intelligibility have been the point of convergence of many research papers and open source commitments. Be that as it may, a large portion of these is equipped with data experts and trained professionals. Shapash is a Python library to imagines AI models’ dynamic interaction. It expects to make AI models reliable for everybody by making them more straightforward and straightforward. Shapash makes straightforward visualizations of global and local reasonableness.
It additionally works with making a web application that can give a great deal of significant worth to end clients and entrepreneurs. Shapash is viable with most sklearn, lightgbm, xgboost, catboost models and can be utilized for classification and regression tasks. It utilizes a Shap backend to figure the local commitment of features, however, this can be supplanted with some other strategy for computing local commitments. Data scientists can utilize the Shapash explainer for investigating and troubleshooting their models or deploy to furnish visualizations with each surmising.

Objective of Shapash
1. To show clear and reasonable outcomes: Plots and outputs utilize labels for each component and its modalities:
2. To permit Data Scientists to rapidly comprehend their models by utilizing a web app to effortlessly explore among worldwide and neighborhood logic, and see how the various highlights contribute:
.png)
3. To Summarize and export the nearby explanation: Shapash proposes a short and clear nearby explanation. It permits every client, whatever their Data background is, to comprehend a nearby expectation of a managed model, because of a summed up and clear clarification of Shapash Features.
4. Full Data science Report
Check the report example here
Shapash Features
Some of the features of Shapash are shown below:
- Machine Learning models: It works with both classification (Binary or Multiclass problems) and Regression problems. It supports many models like Catboost, Xgboost, LightGBM, Sklearn Ensemble, Linear models, and SVM.
- Feature Encoding: It supports a large number of encoding techniques to handle categorical features in our dataset like One Hot Encoding, Ordinal Encoding, Base N Encoding, Target Encoding, or Binary Encoding, etc.
- SklearnColumnTransformer: OneHotEncoder, OrdinalEncoder, StandardScaler, QuantileTransformer or PowerTransformer
- Visualizations: Provides a set of visuals to easily interpret your results. Display understandable and clear results.
- It is compatible with Lime and Shap. It uses Shap backend to show results in just a few lines of code.
- It provides a lot of options for parameters to get your results concisely.
- Shapash is not difficult to install and utilize: It gives a SmartExplainer class to comprehend your model and sum up clarification with straightforward syntax.
- Deployment: Important for investigation and deployment(through an API or in Batch mode) for operational use. Easy web app creation to navigate from global to local.
- High versatility: Very couple of contentions are needed to show results. However, the more you work on cleaning and archiving the data, the more clear the outcomes will be for the end client.
How does Shapash Work
Shapash is a package that makes machine learning understandable and interpretable. Data Enthusiasts can understand their models easily and at the same time can share them. Shapash uses Lime and Shap as a backend to show results in just a few lines of code. Shapash depends on the various advances important to build a Machine Learning model to make the outcomes reasonable. The below image shows the working of the shapash package:
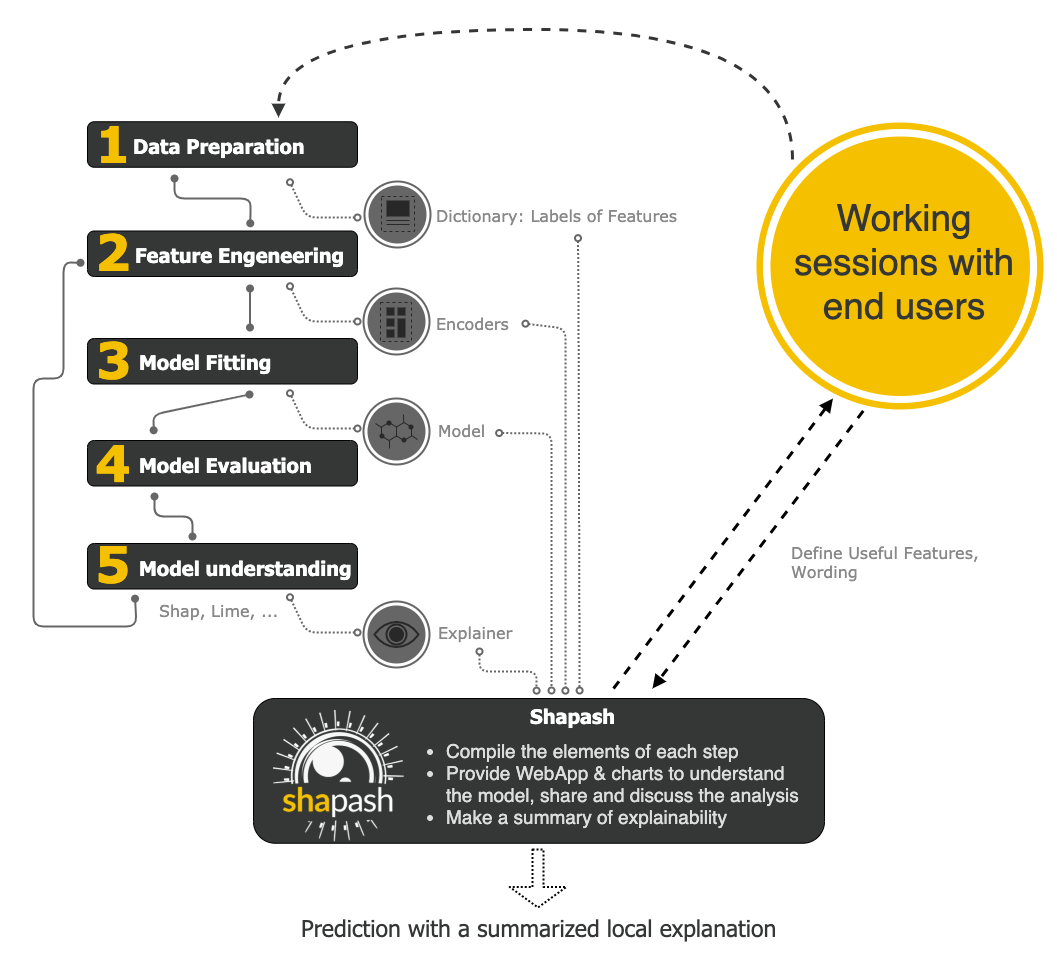
It works on the following principle:
- First, it compiles the elements of each step like Data Preparation, Feature Engineering, Model Fitting, model Evaluation and Model Understanding
- Secondly, It provides a WebApp and charts to understand the model better. We can share and discuss our results with clients.
- Lastly, It provides you with a summary of explainability.
Installation
Shapash can be installed using the below code:
pip install shapash
For Jupyter notebook: If you are using jupyter notebook and you want to see inline graphs, then you need to use one more command other than the above command:
pip install ipywidgets
Getting Started
In this section, we are going to explore Shapash by using the dataset House Prices Prediction. It is a regression problem where we have to predict house prices. The link for the dataset is here. First, let’s analyse the dataset including univariate and bivariate analysis then model explainability using Feature Importance, Feature Contribution, Local and Compare plots after that Model performance and finally WebApp.
Dataset Analysis
Univariate Analysis
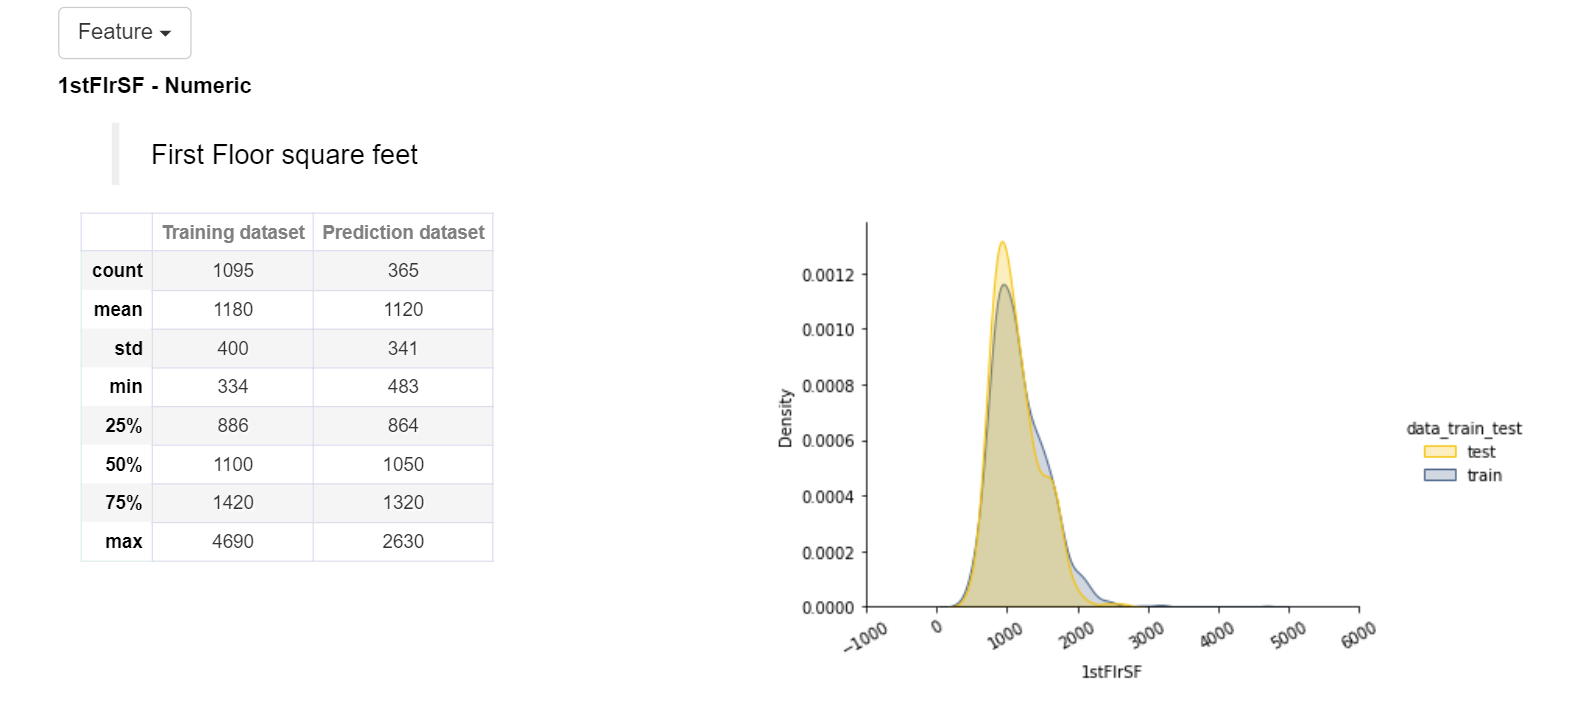
Use can see the below image for a feature named First Floor Square Feet. We can see a table that shows broad statistics of our train and test dataset like mean, max, min, standard deviation, median, and many more. On the right-hand side, we can see distribution graphs for both training and test datasets. Shapash also mentions whether our feature is categorical or numerical and it also gives you the option of the dropdown. In the drop-down, all the features are available.
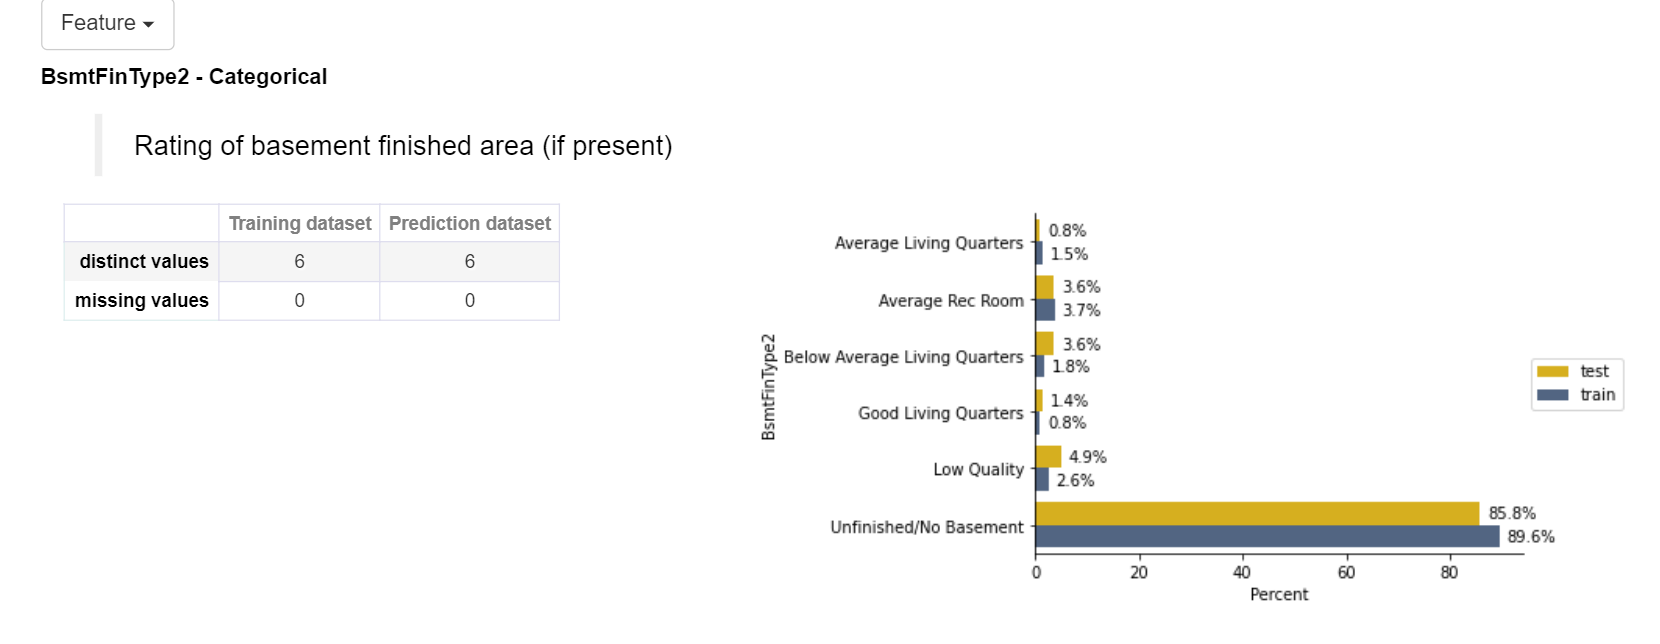
For categorical features, distinct values and missing values are shown for the training and test dataset. On the right-hand side, a bar plot is shown with the respective percentage of category in a feature.
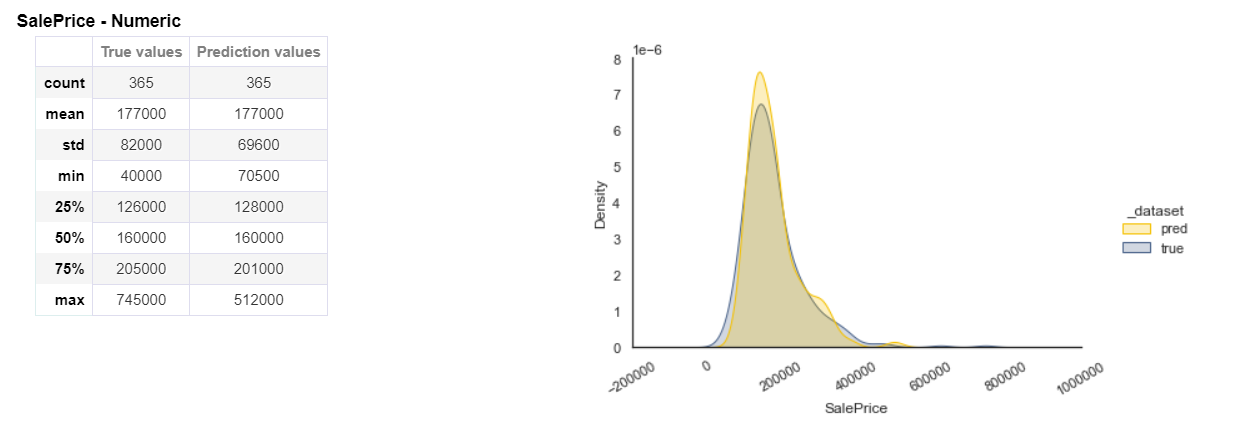
Target Analysis
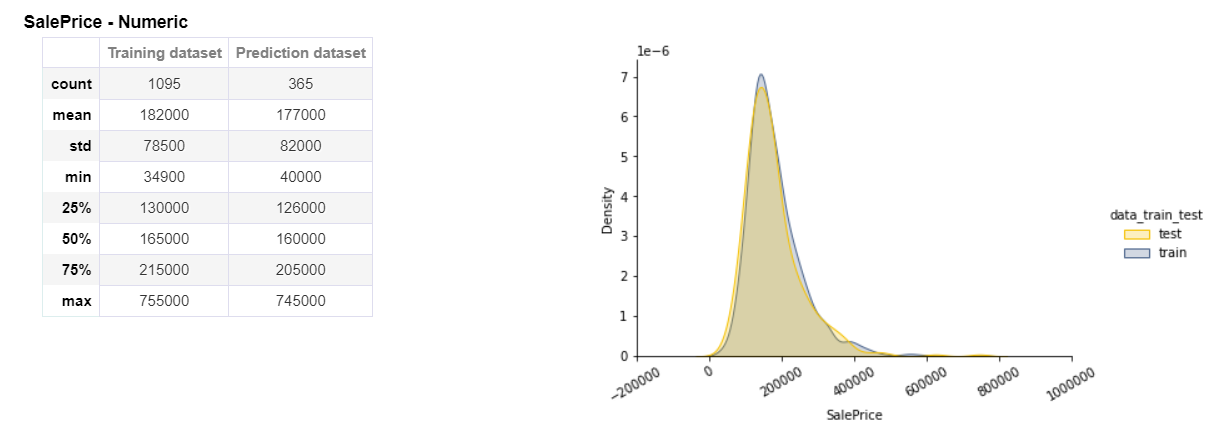
We can also see the detailed analysis of our target variable called Sales Price. On the left-hand side, all the statistics are shown like count, mean, standard deviation, min, max, median, and many more for both training and prediction datasets. On the right-hand side, a distribution is shown for both training and prediction datasets.
Multivariate Analysis
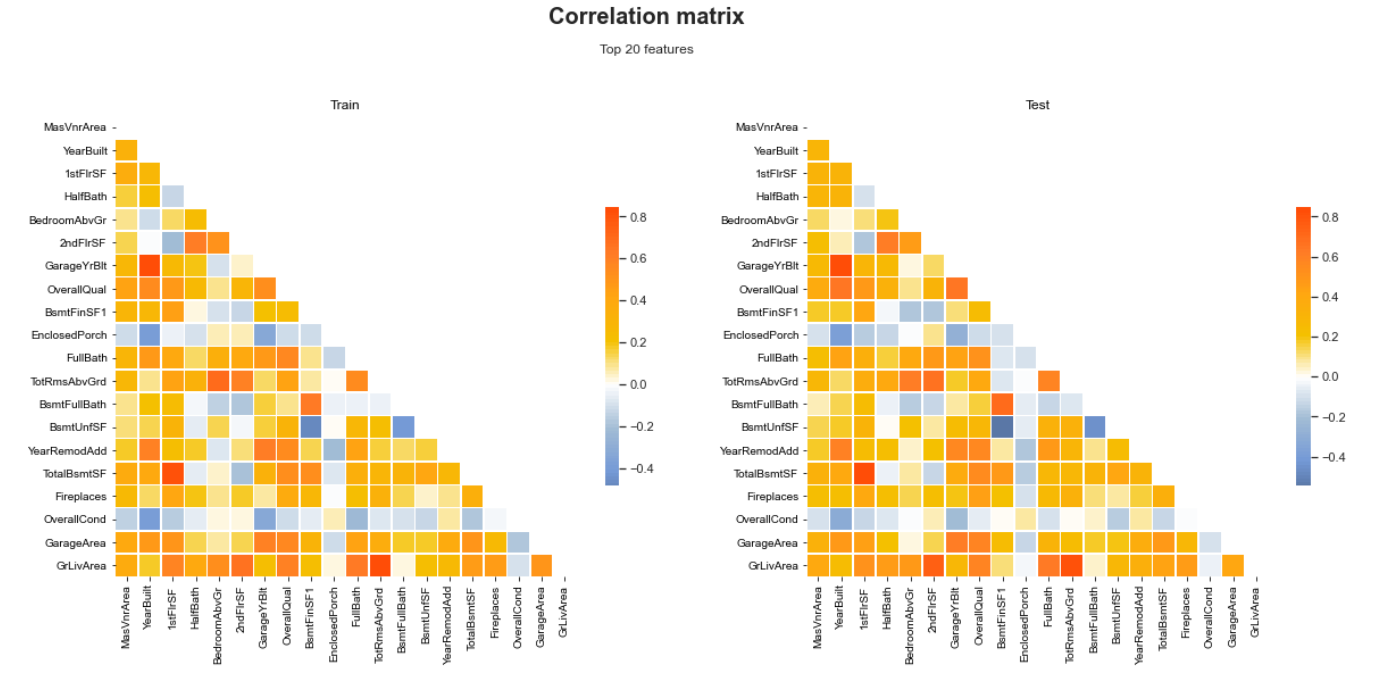
In the previous section, we had a detailed discussion on univariate analysis. In this section, we are going to see Multivariate Analysis. The below image shows the Correlation Matrix of the top 20 features for both training and testing datasets. A correlation scale is also shown based on different colors. That’s how we can visualize the relation between features using Shapash.
Model Explainability
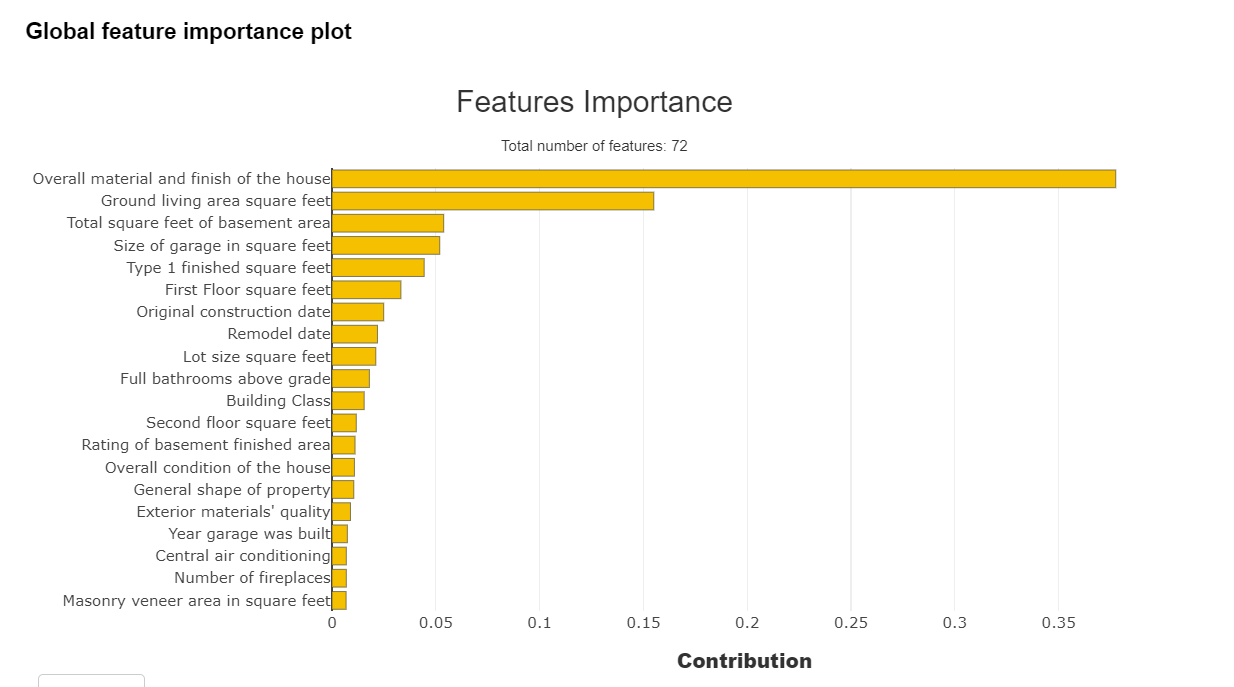
Feature Importance Plot
By using this package, we can see the feature’s importance. Feature importance is a way to find the importance of input features in predicting the output value. The below image shows the feature importance curve
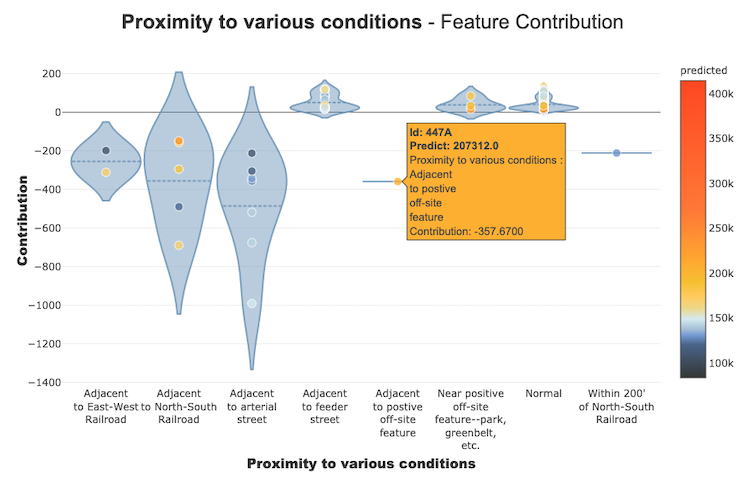
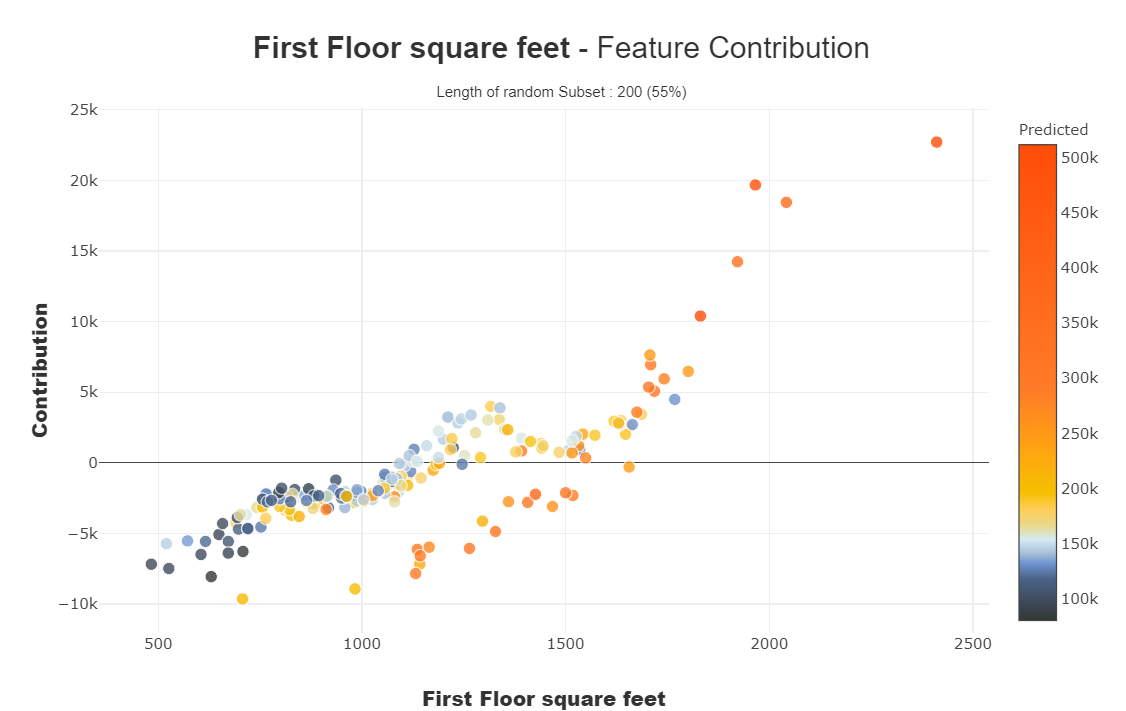
Feature Contribution Plot
These curves help us to answer the questions like how does a feature impacts my prediction, does it contribute positively or negatively, etc. This plot finishes the significance of the highlights for the interpretability, the global coherence of the model to all the more likely comprehend the impact of a feature on a model.
We can see the contribution plots for both numerical and categorical features.
For numerical feature:
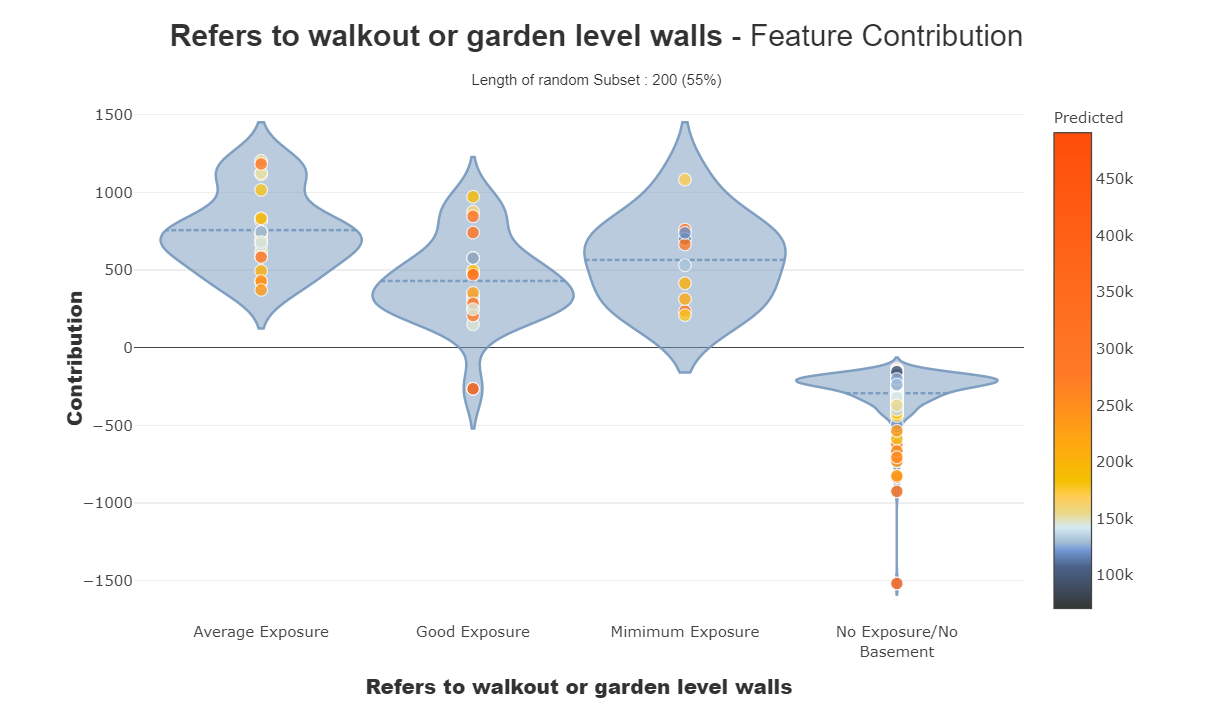
For categorical feature:
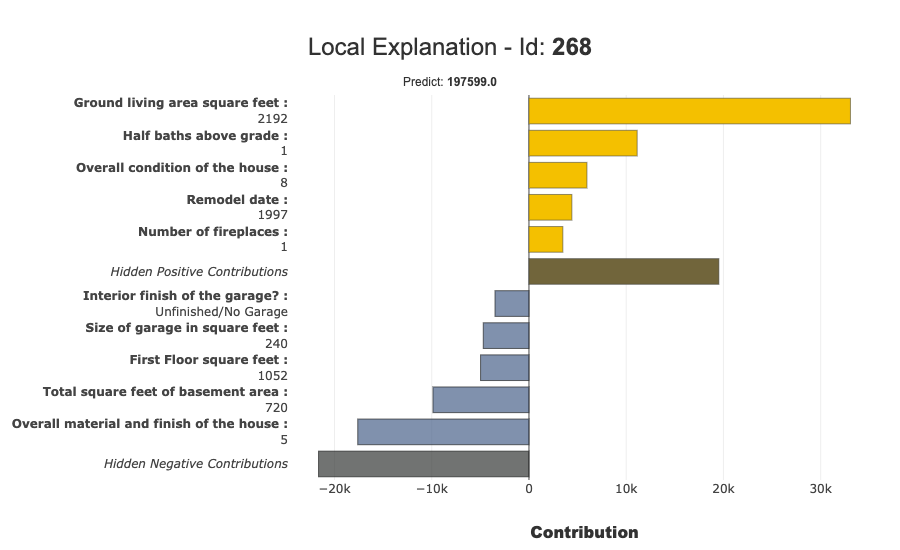
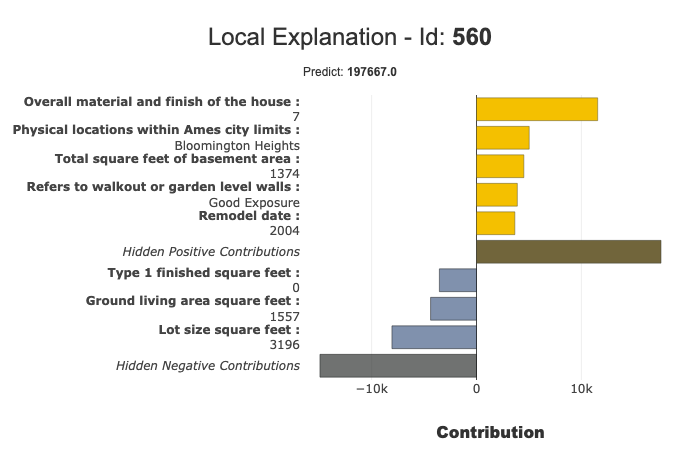
Local Plot
We can draw Local plots. The Below image shows the local plot:
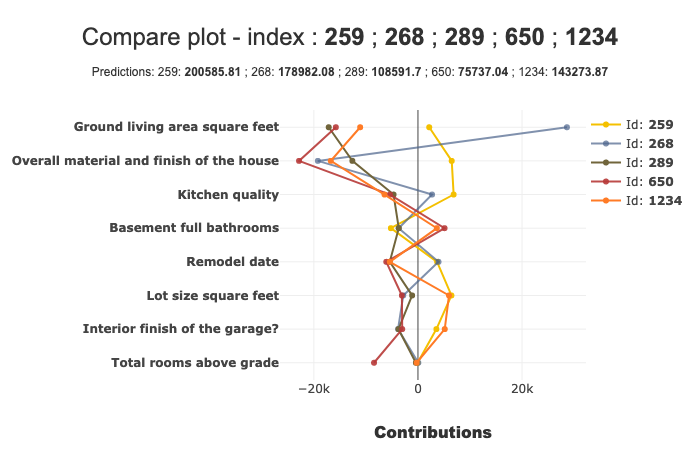
Compare Plot
We can draw Compare plots. The below image shows the compare plot:
Model Performance
After Data Analysis, we are training the Machine learning model. The below image shows the output of our prediction. On the left-hand side, statistics like count, min, max, median, standard deviation etc are shown for true values and predicted values. On the right-hand side, a distribution is shown for both predicted and actual values.
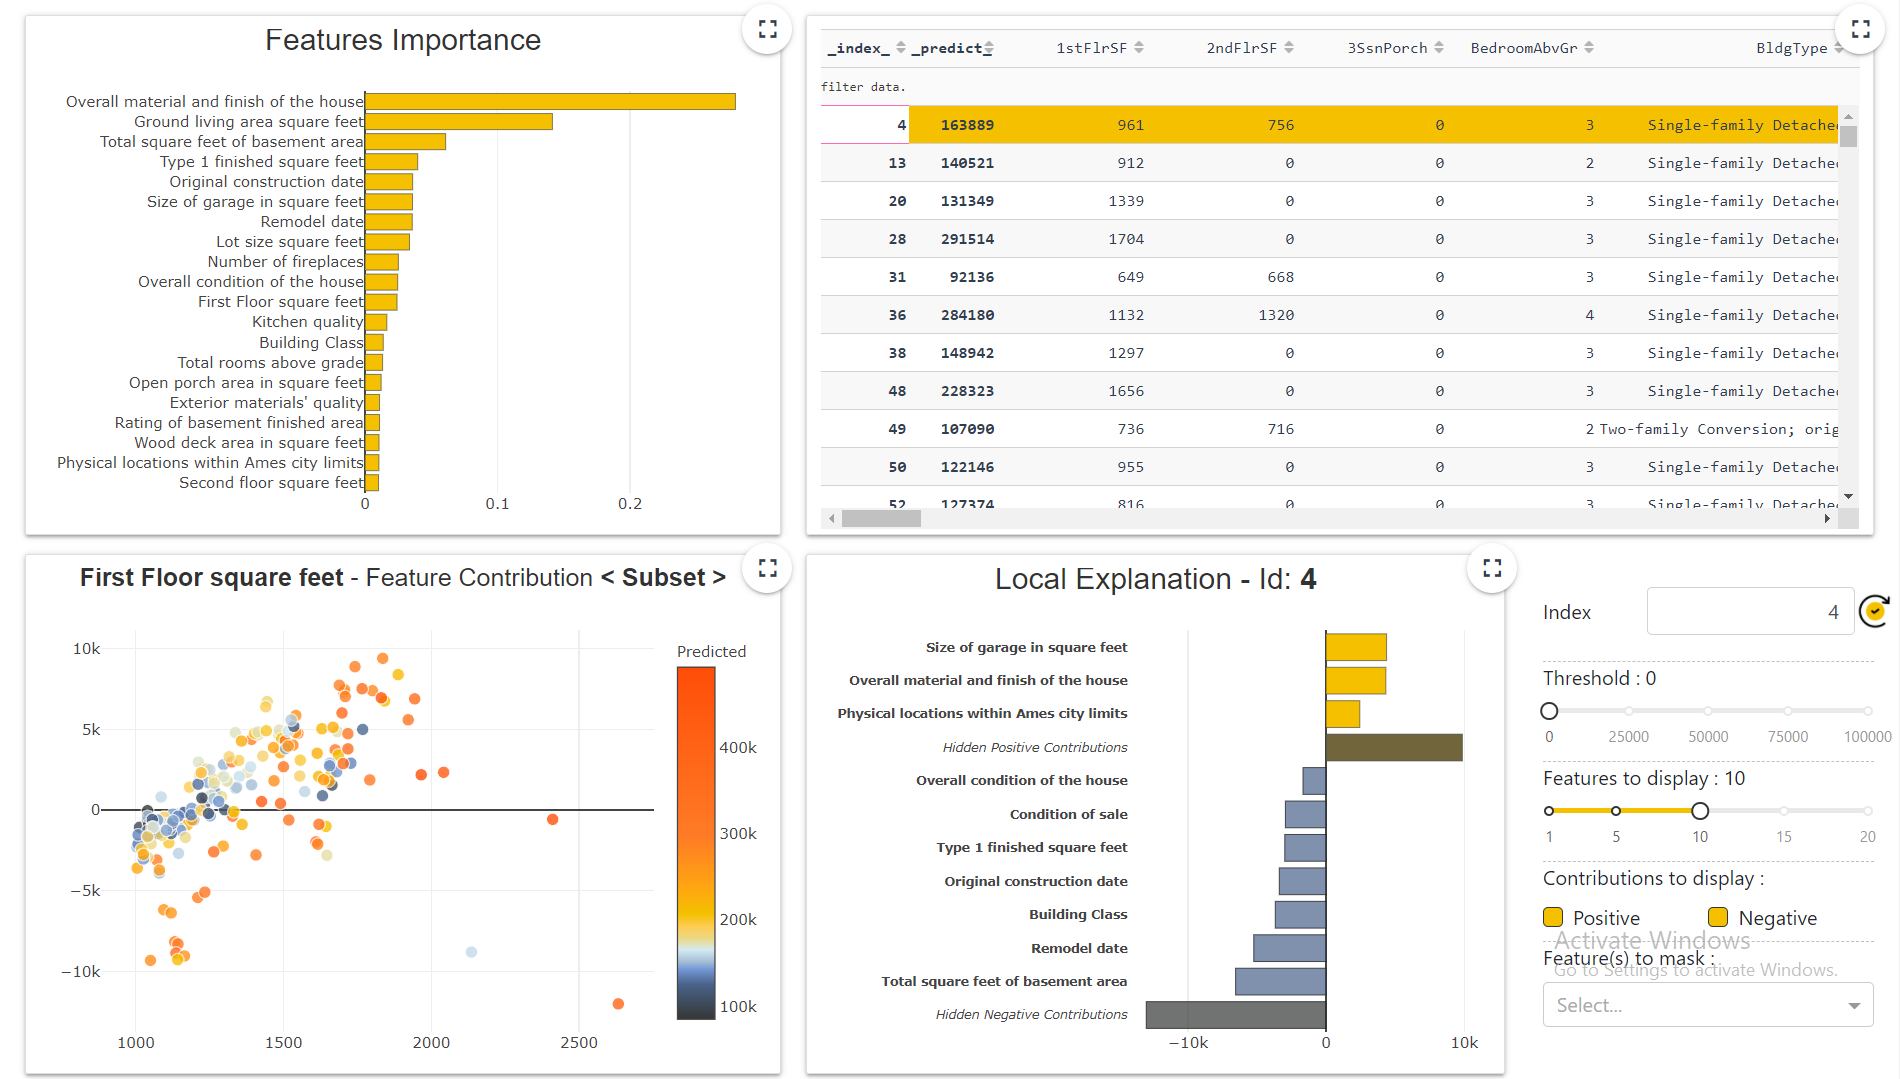
Web App
After a model training, we can build a WebApp as well. This web app shows a complete dashboard of our data including the things which we have covered till now. The below image shows the dashboard.
For more information, check this Link
Conclusion
In this blog, we have studied Shapash in a detailed discussion. You can try this library to automate machine learning tasks and save your time.
You can check my articles here: Articles
Thanks for reading this article and for your patience. Do let me in the comment section. Share this article, it will give me the motivation to write more blogs for the data science community.
Email id: gakshay1210@gmail.com
Follow me on LinkedIn: LinkedIn
The media shown in this article are not owned by Analytics Vidhya and are used at the Author’s discretion.


Hiya, thanks for the article, would you please let me know what method plots the correlation Matrix figure in multivariate analysis? Cheers