In machine learning and data science, evaluating a model is as important as building it. Accuracy is often the first metric people use, but it can be misleading when the data is imbalanced. For this reason, metrics such as precision, recall, and F1 score are widely used. This article focuses on the F1 score. It explains what the F1 score is, why it matters, how to calculate it, and when it should be used. The article also includes a practical Python example using scikit-learn and discusses common mistakes to avoid during model evaluation.
Table of contents
- What Is the F1 Score in Machine Learning?
- When Should You Use the F1 Score?
- Real-World Use Cases of the F1 Score
- How to Calculate the F1 Score Step by Step
- Computing the F1 Score in Python using scikit-learn
- Understanding Classification Report Output in scikit-learn
- Best Practices and Common Pitfalls in the use of F1 Score
- Conclusion
- Frequently Asked Questions
What Is the F1 Score in Machine Learning?
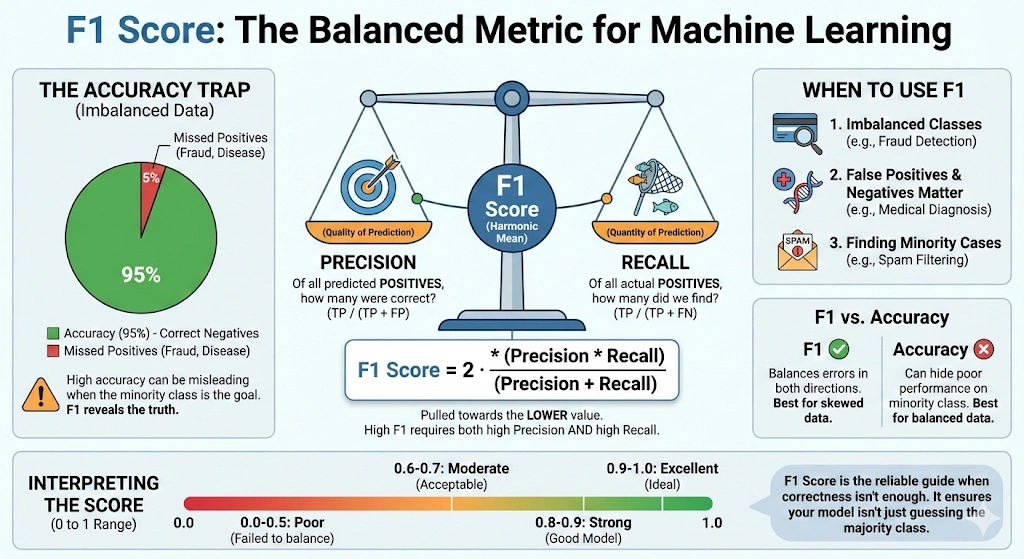
The F1 score, also known as the balanced F-score or F-measure, is a metric used to evaluate a model by combining precision and recall into a single value. It is commonly used in classification problems, especially when the data is imbalanced or when false positives and false negatives matter.
Precision measures how many predicted positive cases are actually positive. In simple terms, it answers the question: out of all predicted positive cases, how many are correct. Recall, also called sensitivity, measures how many actual positive cases the model correctly identifies. It answers the question: out of all real positive cases, how many did the model detect.
Precision and recall often have a tradeoff. Improving one can reduce the other. The F1 score addresses this by using the harmonic mean, which gives more weight to lower values. As a result, the F1 score is high only when both precision and recall are high.
F1 = 2 × Precision × Recall Precision + Recall
The F1 score ranges from 0 to 1, or from 0 to 100%. A score of 1 indicates perfect precision and recall. A score of 0 indicates that either precision or recall is zero, or both. This makes the F1 score a reliable metric for evaluating classification models.
Also Read: 8 Ways to Improve Accuracy of Machine Learning Models
When Should You Use the F1 Score?
When the precision alone cannot provide a clear picture of the model’s performance, the F1 score is employed. This mostly occurs in lopsided data. A model might be highly accurate in such situations, only by making predictions on the majority of class. Nevertheless, it can totally fail to identify minority groups. F1 score is useful in solving this issue because it pays attention to precision and recall.
F1 score comes in handy when the false positives are important as well as the false negatives. It provides one value by which a model balances these two categories of errors. To have a high F1 score on a model, it must perform well on precision and recall. This renders it more dependable than precision in most tasks done in the real world.
Real-World Use Cases of the F1 Score
F1 score is usually utilized in the following situations:
- Imbalanced classification issues like spam filtering, fraud detection, and medical diagnosis.
- The information retrieval and search systems, in which the useful results should be located with a minimal number of false coincidences.
- Model or threshold tuning, when both precision and recall are important.
When one form of error is significantly more expensive than the other one, then that type of error should not be applied independently to F1 score. Recall might be more significant in case it is worse to miss a positive case. When false alarms are more bad, accuracy can be the superior point of attention. When accuracy and the ability to recall are of equal significance, the F1 score is the most suitable.
How to Calculate the F1 Score Step by Step
The F1 score can be calculated once precision and recall are known. These metrics are derived from the confusion matrix in a binary classification problem.
Precision measures how many predicted positive cases are actually positive. It is defined as:
Precision = TP TP + FP
Recall is used to determine the number of actual positives that are retrieved. It is defined as:
Recall = TP TP + FN
Here, TP represents true positives, FP represents false positives, and FN represents false negatives.
F1 Score Formula Using Precision and Recall
After knowing precision (P) and recall (R), the F1 score can be determined as the harmonic mean of the two:
F1 = 2 × P × R P + R
The harmonic mean gives more weight to smaller values. As a result, the F1 score is pulled toward the lower of precision or recall. For example, if precision is 0.90 and recall is 0.10, the F1 score is approximately 0.18. If both precision and recall are 0.50, the F1 score is also 0.50.
This ensures that a high F1 score is achieved only when both precision and recall are high.
F1 Score Formula Using the Confusion Matrix
One can also write out the same formula using terms of the confusion matrix:
F1 = 2 TP 2 TP + FP + FN
Considering an example, when the model is characterized by the precision of 0.75 and a recall of 0.60, the F1 score is:
F1 = 2 × 0.75 × 0.60 0.75 + 0.60 = 0.90 / 1.35 ≈ 0.67
In multi-class classification problems, the F1 score is computed separately for each class and then averaged. Macro averaging treats all classes equally, while weighted averaging accounts for class frequency. In highly imbalanced datasets, weighted F1 is usually the better overall metric. Always check the averaging method when comparing model performance.
Computing the F1 Score in Python using scikit-learn
An example of binary classification is as follows. Precision, recall, and F1 score will be calculated with the help of scikit-learn. This assists in demonstrating the way these metrics are practical.
To begin with, bring in the necessary functions.
from sklearn.metrics import precision_score, recall_score, f1_score, classification_report Now, define the true labels and the model predictions for ten samples.
# True labels
y_true = [1, 1, 1, 1, 1, 0, 0, 0, 0, 0]   # 1 = positive, 0 = negative

# Predicted labels
y_pred = [1, 0, 1, 1, 0, 0, 0, 1, 0, 0]
Next, compute precision, recall, and the F1 score for the positive class.
precision = precision_score(y_true, y_pred, pos_label=1)
recall = recall_score(y_true, y_pred, pos_label=1)
f1 = f1_score(y_true, y_pred, pos_label=1)

print("Precision:", precision)
print("Recall:", recall)
print("F1 score:", f1)
You can also generate a full classification report.
print ("\nClassification Report:\n", classification_report(y_true, y_pred)) Running this code produces output like the following:
Precision: 0.75
Recall: 0.6
F1 score: 0.6666666666666666
Classification Report:
Understanding Classification Report Output in scikit-learn
Let’s interpret these results.
In the positive category (label 1), the accuracy is 0.75. This implies that three quarters of the samples that were postulated to be positive were positive. The recall is 0.60 indicating that the model identified 60% of all the true positive samples correctly. When these two values are added, the result is a value of about F1 of 0.67.
In case of the negative category (label 0), the recall is larger at 0.80. This demonstrates that the model is more effective in identifying negativism than positivism. Its accuracy is 70% overall, which is not a measurement of the effectiveness of the model in each separate classification.
This can be easier viewed in the classification report. It presents precision, recall, and F1 by the class, macro, and weighted averages. In this balanced case, the macro and weighted F1 scores are comparable. Weighted F1 scores in more unbalanced datasets places more emphasis on the dominant class.
This is demonstrated by a practical example of computing and interpreting the F1 score. The F1 score on the validation/test data in real projects would be used to determine the balance of false positives and false negatives would be like your model is.
Best Practices and Common Pitfalls in the use of F1 Score
Choose F1 based on your objective:
- F1 is used when recall and precision are equally important.
- There is no need to use F1 when one form of erroneousness is more expensive.
- Use weighted F-scores where necessary.
Do not rely on F1 alone:
- F1 is a combined metric.
- It hides the balance between precision and recall.
- Always review precision and recall separately.
Handle class imbalance carefully:
- F1 performs well as compared to accuracy when faced with imbalanced data.
- Averaging methods affect the final score.
- Macro F1 treats all classes equally.
- Weighted F1 favors frequent classes.
- Pick the method that reflects your goals.
Watch for zero or missing predictions:
- F1 can be zero when a class is never predicted.
- This may signal a model or data issue.
- Always inspect the confusion matrix.
Use F1 wisely for model selection:
- F1 works well for comparing models.
- Small differences may not be meaningful.
- Combine F1 with domain knowledge and other metrics.
Conclusion
The F1 score is a strong metric for evaluating classification models. It combines precision and recall into a single value and is especially useful when both types of errors matter. It is particularly effective for problems with imbalanced data.
Unlike accuracy, the F1 score highlights weaknesses that accuracy can hide. This article explained what the F1 score is, how it is calculated, and how to interpret it using Python examples.
The F1 score should be used with care, like any evaluation metric. It works best when precision and recall are equally important. Always choose evaluation metrics based on your project goals. When used in the right context, the F1 score helps build more balanced and reliable models.
Frequently Asked Questions
Q1. Is an F1 score of 0.5 good?
A. An F1 score of 0.5 indicates moderate performance. It means the model balances precision and recall poorly and is often acceptable only as a baseline, especially in imbalanced datasets or early-stage models.
Q2. What is a good F1 score?
A. A good F1 score depends on the problem. Generally, scores above 0.7 are considered decent, above 0.8 strong, and above 0.9 excellent, especially in classification tasks with class imbalance.
Q3. Is lower F1 better?
A. No. Lower F1 scores indicate worse performance. Since F1 combines precision and recall, a higher value always means the model is making fewer false positives and false negatives overall.
Q4. Why is F1 score used in ML?
A. F1 score is used when class imbalance exists or when both false positives and false negatives matter. It provides a single metric that balances precision and recall, unlike accuracy, which can be misleading.
Q5. Is 80% accuracy good in machine learning?
A. 80% accuracy can be good or bad depending on context. In balanced datasets it may be acceptable, but in imbalanced problems, high accuracy can hide poor performance on minority classes.
Q6. Should I use accuracy or F1 score?
A. Use accuracy for balanced datasets where all errors matter equally. Use F1 score when dealing with class imbalance or when precision and recall are more important than overall correctness.
Hi, I am Janvi, a passionate data science enthusiast currently working at Analytics Vidhya. My journey into the world of data began with a deep curiosity about how we can extract meaningful insights from complex datasets.


