This article was published as a part of the Data Science Blogathon.
Introduction
As a data scientist, one of the biggest struggles is cleansing the data before one can actually dive into it to get some meaningful insights. Data cleaning is one of the most important steps which should never be ignored. If the data is not cleaned thoroughly, the accuracy of your model stands on shaky grounds
Poor quality of data leads to biased results with low accuracy high error percentages thus, it is important to clean the data thoroughly before fitting a model to it. As a data scientist, it is important to understand that all the data provided to us may not be useful and hence we must know the ways to treat them.
What is data cleaning – Removing null records, dropping unnecessary columns, treating missing values, rectifying junk values or otherwise called outliers, restructuring the data to modify it to a more readable format, etc is known as data cleaning.

One of the most common data cleaning examples is its application in data warehouses. A data warehouse stores a variety of data from numerous sources and optimizes it for analysis before any model fitting can be done.
Data cleaning is not just erasing the existing information to add the new information, but rather finding a way to maximize a data set’s accuracy without necessarily losing the existing information. Different types of data will require different types of cleaning, but always remember that the correct approach is the deciding factor.
After cleansing the data, it will become consistent with other similar data sets in the system. Let’s look at the steps for cleaning the data ;
Removing Null/Duplicate Records
If in a particular row a significant amount of data is missing, then it would be better to drop that row as it would not be adding any value to our model. you can impute the value; provide an appropriate substitute for the missing data. Also always remember to delete duplicate/ redundant values from your dataset as they might result in a bias in your model.
For example, let us consider the student dataset with the following records.
| name | score | address | height | weight |
| A | 56 | Goa | 165 | 56 |
| B | 45 | Mumbai | 3 | 65 |
| C | 87 | Delhi | 170 | 58 |
| D | ||||
| E | 99 | Mysore | 167 | 60 |
As we see that corresponding to student name “D”, most of the data is missing hence we drop that particular row.
student_df.dropna() # drops rows with 1 or more Nan value
#output
| name | score | address | height | weight |
| A | 56 | Goa | 165 | 56 |
| B | 45 | Mumbai | 3 | 65 |
| C | 87 | Delhi | 170 | 58 |
| E | 99 | Mysore | 167 | 60 |
Dropping unnecessary Columns
When we receive the data from stakeholders, generally it is huge. There can be a log of data that might not add any value to our model. Such data is better removed as it would valuable resources like memory and processing time.
For example, while looking at students’ performance over a test, students’ weight or their height does not have anything to contribute to the model.
student_df.drop(['height','weight'], axis = 1,inplace=True) #Drops Height column form the dataframe
#Output
| name | score | address |
| A | 56 | Goa |
| B | 45 | Mumbai |
| C | 87 | Delhi |
| E | 99 | mysore |
Renaming columns
It’s always better to rename the columns and format them to the most readable format which can be understood by both the data scientist and the business. For example in the student data set, renaming the column “name” as “Sudent_Name” makes it meaningful.
student_df.rename(columns={'name': 'Student_Name'}, inplace=True) #renames name column to Student_Name
#Output
| Student_Name | score | address |
| A | 56 | Goa |
| B | 45 | Mumbai |
| C | 87 | Delhi |
| E | 99 | Mysore |
Treating missing values
There are many ways to take care of the missing values in a dataset. It’s up to the data scientist and the dataset in hand to choose the most appropriate method. The most commonly used methods are imputing the dataset with mean, median, or mode. Removing those particular records with one or more values missing and in some cases creating machine learning algorithms like linear regression and K nearest neighbor is also used for treating the missing values.
| Student_Name | score | address |
| A | 56 | Goa |
| B | 45 | Mumbai |
| C | Delhi | |
| E | 99 | Mysore |
Student_df['col_name'].fillna((Student_df['col_name'].mean()), inplace=True) # Na values in col_name is replaced with mean
#Output
| Student_Name | score | address |
| A | 96 | Goa |
| B | 45 | Mumbai |
| C | 66 | Delhi |
| E | 99 | Mysore |
Outlier Detection
Outliers can be considered as noise in the dataset. There can be several reasons for outliers like data entry error, manual error, experimental error, etc.
For example, In the below example, the score of student”B” is entered 130 which is clearly not correct.
| Student_Name | score | address | height | weight |
| A | 56 | Goa | 165 | 56 |
| B | 45 | Mumbai | 3 | 65 |
| C | 66 | Delhi | 170 | 58 |
| E | 99 | Mysore | 167 | 60 |
Plotting height on a box plot gives the below result
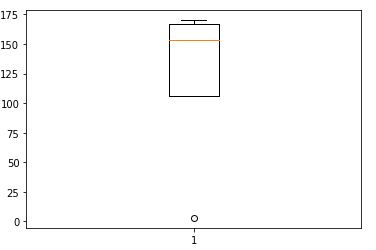
Not all extreme values are outliers, some can also lead to interesting discoveries but that’s a topic for some other day. One can use tests like the Z score test, box plot, or simply plotting the data on the graph will reveal the outliers.
Reshape/restructuring the data
Most of the business data provided to the data scientist are not in the most readable format. It’s our job to reshape the data and get it to the format which can be used for analysis. For example, creating a new variable from the existing variables or combining 2 or more variables.
Footnotes
There are certainly numerous advantages of working with clean data few of which are improved accuracy of the models, better decision making by the stakeholders, ease of model implementation and parameter tuning, saves time and resources, and many more. Always remember to clean the data as the first and most important step before fitting any model to it.
References
https://www.geeksforgeeks.org/
The media shown in this article are not owned by Analytics Vidhya and is used at the Author’s discretion.


Quite informative and helpful.Thank you so much for sharing all this wonderful info.