Introduction
Anomaly is something that is not normal. Any data point which is placed at a distance from all normal data points is an anomaly. Hence anomalies are also called outliers.
Anomaly detection is also called as deviation detection because anomalous objects have attribute values that are different from all normal data objects.
Everyone loves a mystery and that is what anomaly detection is – spotting the unusual, catching the fraud, discovering the strange activity.
This article was published as a part of the Data Science Blogathon.
What is Anomaly Detection?
The dictionary definition of an anomaly is something that deviates from what is standard, normal, or expected. In the context of data science, an anomaly is a data point that deviates much from the expected fashion.

Types of Anomalies
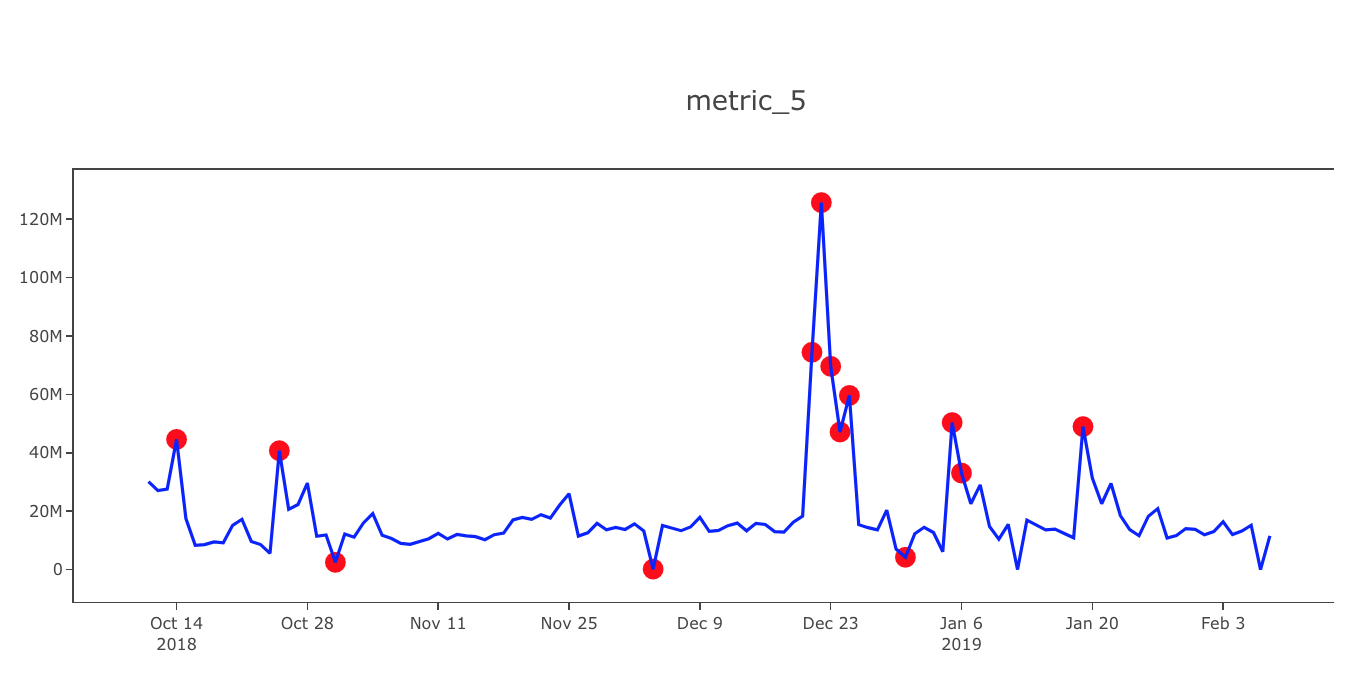
- Point anomalies – A sole instance of data is abnormal if it is too distant from the remainder. Use case – Detecting MasterCard fraud based on amount spent.
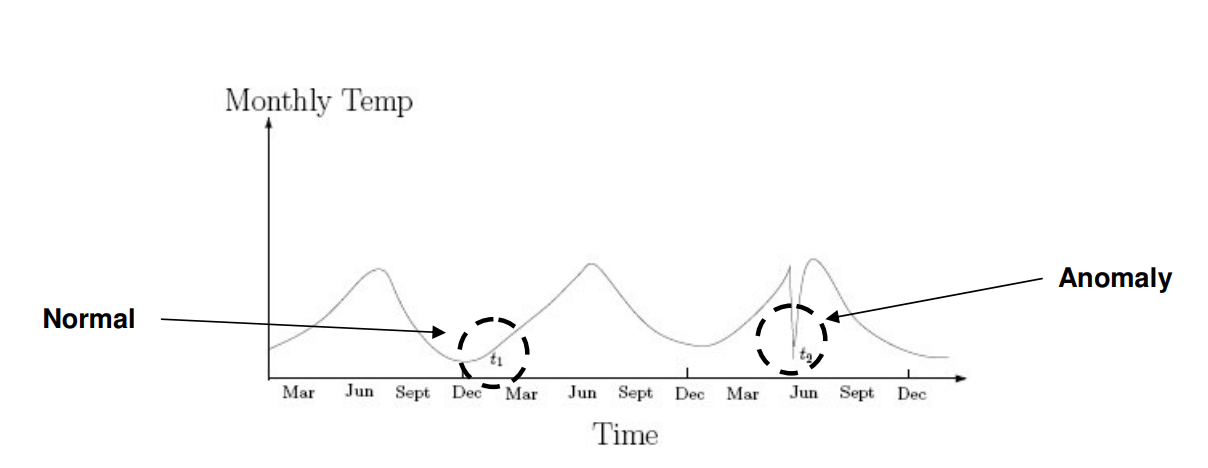
- Contextual anomalies – In certain contexts, abnormality is defined by specific criteria. One instance where this anomaly detection becomes pertinent is in time-series data analysis. For example, consider the scenario where the amount spent on petrol daily during regular working days is considered normal behavior. However, this pattern would be flagged as unusual if similar expenditures were made during vacation periods. To tackle such anomalies, machine learning techniques, particularly the isolation forest algorithm, are employed. Isolation forest, among other anomaly detection algorithms, plays a crucial role in identifying such deviations from expected patterns within datasets.
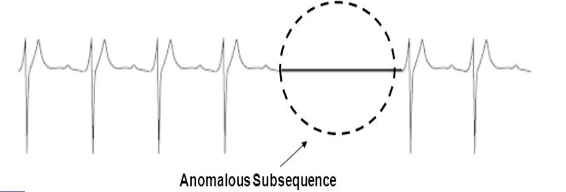
- Collective anomalies – A set of data instances put together helps in detecting anomalies. Use case – Someone attempting to copy data from a remote machine to a local host unexpectedly such an anomaly would be flagged as possible cyber-attack.
Causes of Anomalies
1. Data from different classes
An object may be different because it is of a different class. Cases like credit card theft, Intrusion detection, outcome of disease, abnormal test result are good examples of anomalies occurring and identified using class labels.
2. Natural variation
In a Normal or Gaussian distribution the probability of a data object decreases rapidly. Such objects are considered as anomalies. These are also called as outliers.
3. Data measurement and Collection Errors
These kinds of errors occur when we collect erroneous data or if there is any deviation while measuring data.
Where is Anomaly Detection Used?
- Data Breaches
- Identity Theft
- Manufacturing
- Networking
- Medicine
- Video Surveillance
What is Anomaly Detection Good for?
- To find unusual values of metrics in order to find undetected problems.
- To find changes in an important metric or process so that humans can investigate.
- To reduce the surface area or search space diagnosing a problem that has been detected.
- To reduce the need to calibrate or recalibrate thresholds.
- To augment human intuition and judgment.
Drawbacks
- Cannot provide a root cause analysis although it can help in that.
- Unable to provide yes or no answers if there is an anomaly.
- Inefficient to prove that there is an anomaly in the system just that there is something unusual about the metric that is being observed.
- Incapable to detect actual system faults or failures because a fault is not similar to an anomaly.
- It cannot substitute human judgment and experience.
- Incapable to understand the meaning of metrics.
Anomaly Detection Approaches
- Model-based
In this kind of approach a model of the data is built. The objects that do not fit very well are considered as anomalies. For example let us assume that a model is built of certain data which is in the form of cluster. Then anomalies are those data objects that do not strongly belong to the cluster built. In a Regression Model the anomalies are far from predicted value. However, the problem with such approach is when no training data is present to build a model or there is no statistical distribution of data. Therefore, in such cases we require techniques that do not require a data model to be built.
- Distance-based
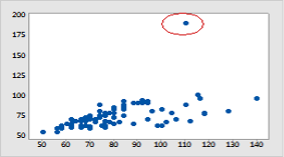
This approach is based on the proximities. Consider a 2D or 3D scatter plot all the data objects are in one proximity. But Anomalous objects are away from them.
- Density-based
Density of objects is easy to compute especially if a proximity measure between objects is available. Low density objects are those that relatively distant from neighbours. We call such objects as Anomalies.
There are three basic categories for anomaly detection:
1. Supervised Anomaly Detection: In this supervised learning there must a training set for both data objects and expected anomalous objects. We have to observe that there can be more than one anomalous class.
2. Unsupervised Anomaly Detection: For situations where class labels are not available. We can give a score for each object that shows the degree to which the instance is anomalous. We also can observe that if there are many anomalies present which are similar to each other, then we can group them as normal group or the outliers score is low. So, we can say that for unsupervised anomaly detection to be successful it is must that anomalies are distinct.
3. Semi Supervised Anomaly Detection: Sometimes when there is training data with labelled normal objects and score given, but has no anomalous objects, then we can implement the semi supervised anomaly detection to find the anomalies. We use the normal objects to find the anomalies. But, the difficulty is sometimes it is not easy to find that representative set of normal objects using which we have to find out anomalies.
Some more details of the Anomaly Detection Approaches
The Model-based Approach (also called Statistical Method)
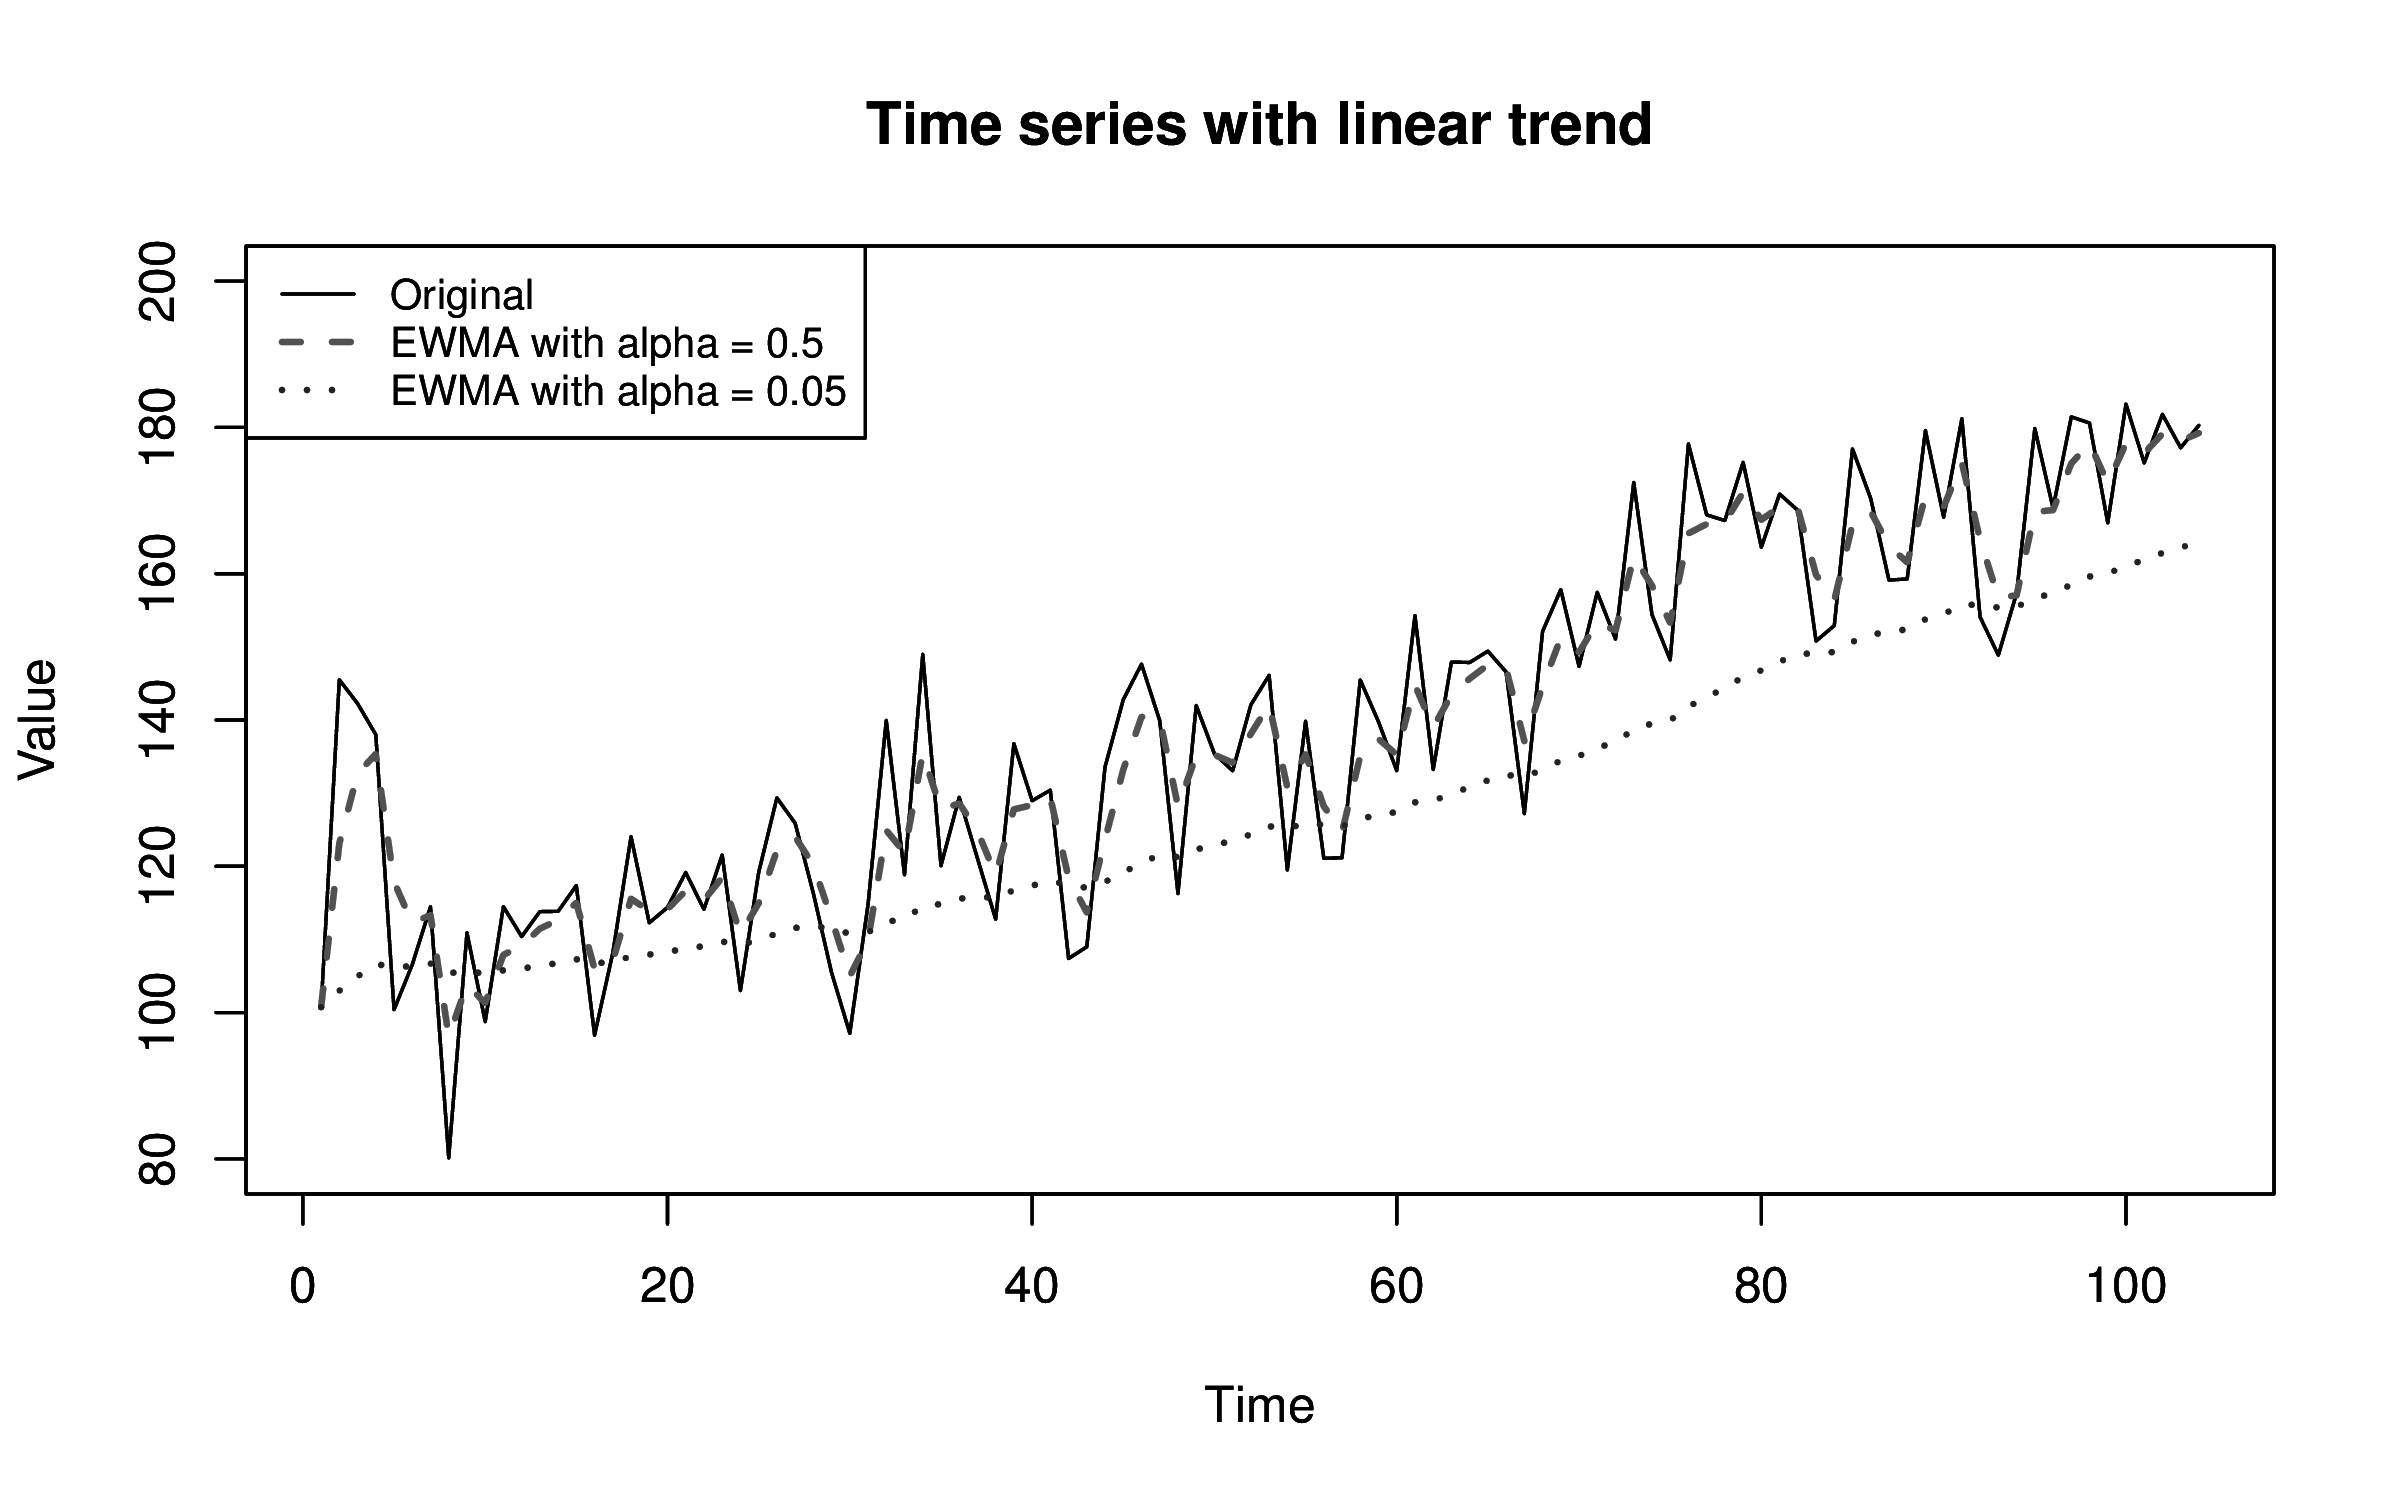
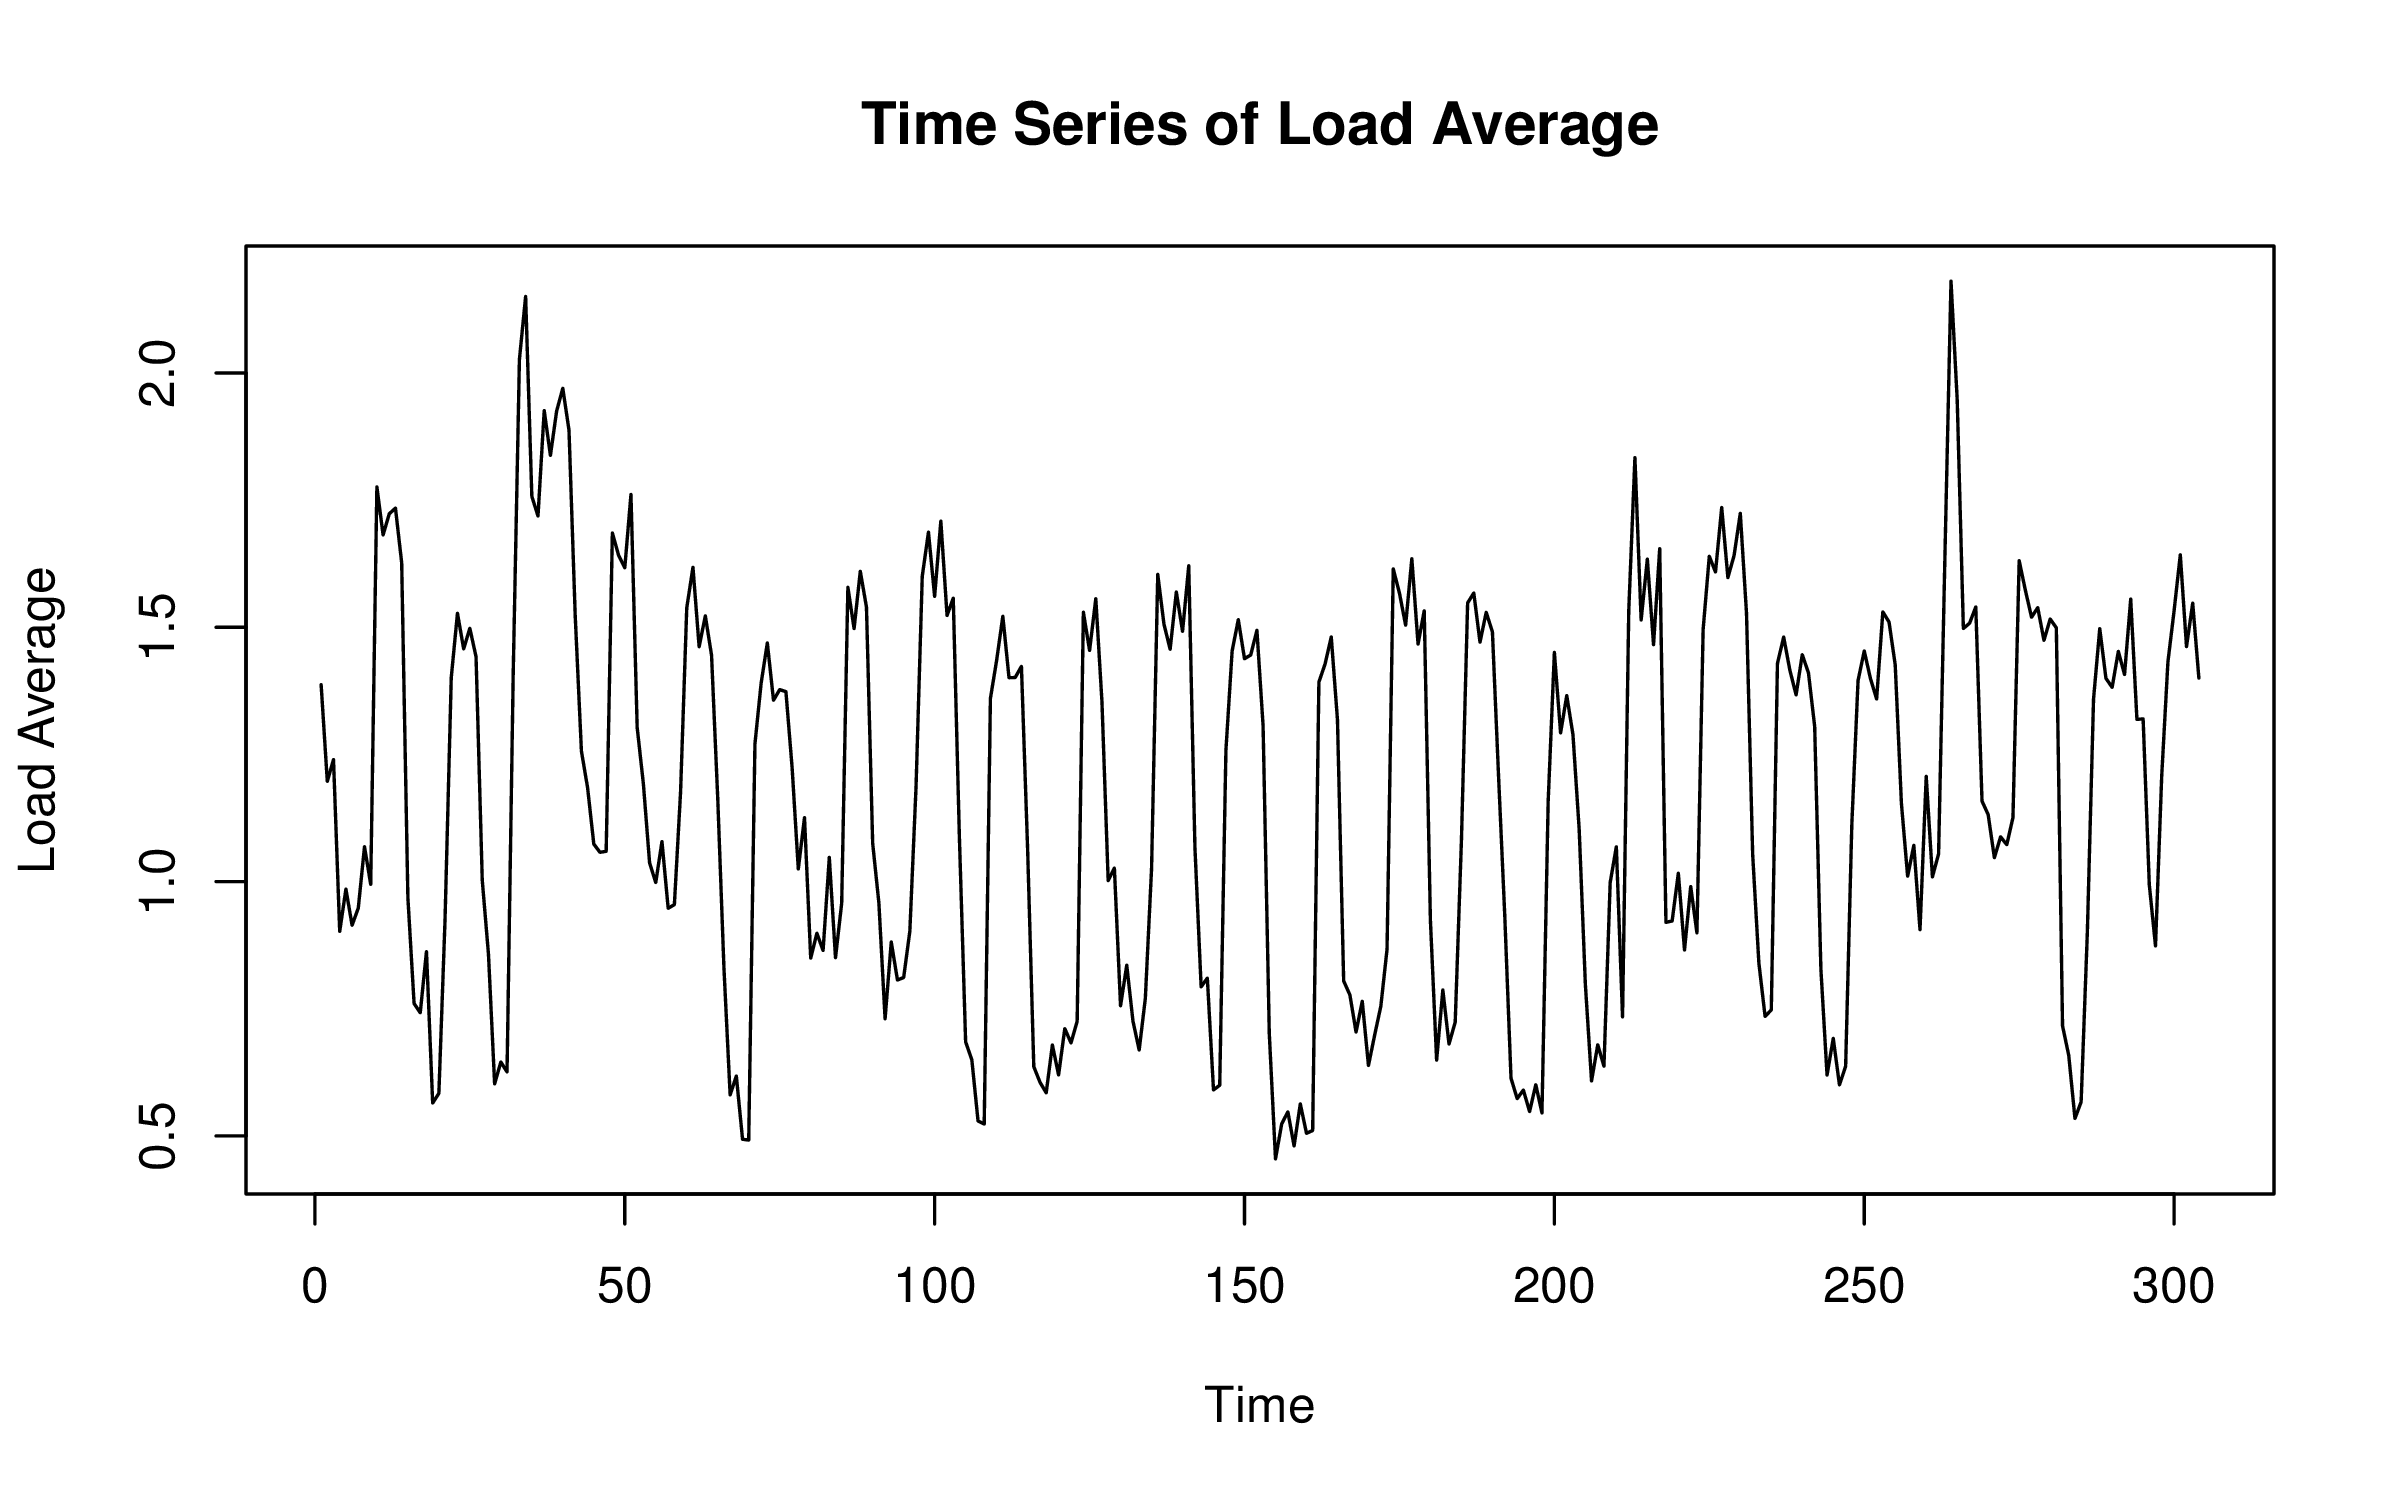
Trends and seasonality are two features of time series metrics that disrupt many models. In fact, they are one of two major reasons why static thresholds break. Trends are continuous increase or decrease in a metrics value. Whereas seasonality reflects periodic patterns that occur in a system, usually rising above a baseline and then decreasing again. Common seasonal periods are hourly, daily, and weekly but your systems may have a seasonal period that is longer or even some combination of different periods.
The Distance-based Approach
Distance-based approach classifies a data point as an anomaly (outlier) if its locality is at sparser area. It is calculated from its distance to all points, distance to nearest neighbor, average distance to k Nearest Neighbor or median distance to k Nearest Neighbor.
The Density-based Approach
Density-based approach determines the density of the region. Density-based clustering uses the localized density of points to decide the clusters, rather than using only the distance between points.
DBSCAN
DBSCAN (Density-based Spatial Clustering of Applications with Noise) is one of the extensively used density-based clustering algorithms which is used in the applications of outlier detection. The basic idea behind DBSCAN is that a cluster has to contain minimum number of points within the specified radius. DBSCAN algorithm uses two parameters, minimum points (“minpts”) and epsilon(“eps”) to perform clustering.
We will take an example to detect outlier using Z score and Interquartile range
First by using Z score
Formula for Z score is (Observation – Mean)/ Standard Deviation
z = (X — μ) / σ

dataset= [11,10,12,14,12,15,14,13,15,102,12,14,17,19,107, 10,13,12,14,12,108,12,11,14,13,15,10,15,12,10,14,13,15,10]

outliers=[]
def detect_outliers(data):

    threshold=3
    mean = np.mean(data)
    std =np.std(data)


    for i in data:
        z_score= (i - mean)/std
        if np.abs(z_score) > threshold:
            outliers.append(y)
    return outliers

outlier_pt=detect_outliers(dataset)

outlier_pt

[102, 107, 108]
Now by using Interquartile Range which is 75% – 25% values in a given dataset
sorted(dataset)
[10, 10, 10, 10, 10, 11, 11, 12, 12, 12, 12, 12, 12, 12, 13, 13, 13, 13, 14, 14, 14, 14, 14, 14, 15, 15, 15, 15, 15, 17, 19, 102, 107, 108]
quartile1, quartile3= np.percentile(dataset,[25,75])
print(quartile1,quartile3)
12.0 15.0
## Find the IQRiqr_value=quartile3-quartile1print(iqr_value)3.0
## Find the lower bound value and the higher bound value

lower_bound_val = quartile1 -(1.5 * iqr)

upper_bound_val = quartile3 +(1.5 * iqr)
print(lower_bound_val, upper_bound_val)
17.5, 19.5
How does anomaly detection work?
Anomaly detection is like having a keen eye for spotting odd things in a crowd. Here’s how it works:
Gathering Data: We collect information from different sources, like sensors or records.
Cleaning Data: We tidy up the data, making sure it’s all good and there are no mistakes.
Picking Important Stuff: We choose the most important details from the data that can help us tell if something’s weird or not.
Training a Model: We teach a computer program to recognize what’s normal based on the data we’ve collected, using techniques like the extended isolation forest algorithm.
If We Have Examples: We use examples of both normal and weird things to teach the program. This is like showing it pictures of cats and dogs to learn the difference.
If We Don’t Have Examples: We let the program figure out what’s normal on its own, perhaps by fitting the data to a normal distribution. It’s like letting it explore a new place and learn what’s usual there.
Checking Performance: We see how well our program can spot weird stuff by comparing it to what we already know is weird or not.
Setting Rules: We decide on a rule for what’s weird and what’s not. It’s like saying, “Anything taller than 7 feet in this room is unusual.”
Watching and Updating: We keep our program running to keep an eye on things. If something new comes up, we teach it so it can recognize that too.
By doing this, we can catch strange occurrences in things like fraud, computer networks, machines, or even people’s health. It’s like having a super-smart friend who notices when something just isn’t right.
Conclusion
Anomaly Detection is a very vast concept; in this guide, we learned about some basic concepts of anomaly detection
- We learnt what anomalies are, their causes and types.
- We also discussed approaches to detect anomalies and how they are used in real world.
- We also saw how they can be used to make better models.
- Anomalies are extremely important to be detected before building a really good model.
- They need to be removed from the data before we can use the data.
- It helps us to alert ourself of any unwanted event that needs to be detected well in advance to prepare ourselves to face situations.
I hope this guide on Anomaly Detection helps you to gain a fair understanding of how anomaly detection works.
The media shown in this article is not owned by Analytics Vidhya and is used at the Author’s discretion.


