This article was published as a part of the Data Science Blogathon
Let’s start with the basics…
What are the objectives an ML model training step is aiming at?
Developing any ML model’s objective is to make them generalizable, reliable, robust (applicable in various scenarios), and have the least bias. As all model algorithms rely on creating an as close version of ground truth as possible – Error Analysis and corresponding actions play a key role in accomplishing this.
ML models have primarily been tested and developed based on single or aggregate metrics like accuracy, precision, recall that cover the model performance on the entire dataset. It does help to tune the overall model performance achieved through further tweaking the algorithms but does not dive into the specifics of the errors to help better resolve the training/test set errors. An in-depth review of the error cases can help systematically arrive at ideas and recommendations to improve the model performance and be as close to the ground truth as possible. Also, error analysis helps to create Responsible ML models by helping identify if the model is behaving more erroneously for certain protected variables/classes.
ML classification models have been used as a case in this article to explain the process better. It is assumed that readers understand the ML model development process in general.
The following is structured per below:
1. What is error analysis in ML?
2. Error Identification and Diagnostics: How and where are the errors distributed for ML classification models?
3. Approach and recommendations for error resolution
1. What is Error Analysis?
Error analysis is the process to isolate, observe and diagnose erroneous ML predictions thereby helping understand pockets of high and low performance of the model. When it is said that “the model accuracy is 90%” it might not be uniform across subgroups of data and there might be some input conditions which the model fails more. So, it is the next step from aggregate metrics to a more in-depth review of model errors for improvement.
An example might be that a dog detection image recognition model might be doing better for dogs in an outdoor setting but not so good in low-lit indoor settings. Of course, this might be due to skewed datasets and error analysis helps identify if such cases impact model performance. The below illustration provides a view of how moving from aggregate to group-wise errors provides a better picture of model performance.
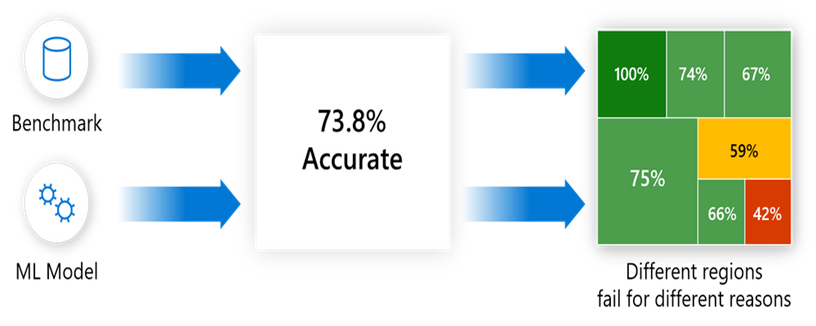
Source: Responsible ML with error analysis
2. Error Identification and Diagnosis
This helps know how errors are distributed across key hypotheses or key features/classes/cohorts of the dataset. For example, in a loan approval model used by a bank, it might be that the model is giving more errors on the individuals who are younger and have a low monthly average balance with the bank.
A. How to do this (manually) especially in case your data is image, voice, or text where you might not have apparent features.
Let us take another example – a favorite one – A cat-classifier! Suppose we train a model on 4000 images (Some having cats) in different settings and test using 1000 images. We find that the model accuracy is 85% (meaning 850 of the 1000 images were predicted correctly!) and 150 images were wrongly tagged.
Sample of Images with Erroneous Classification in Cat-classifier
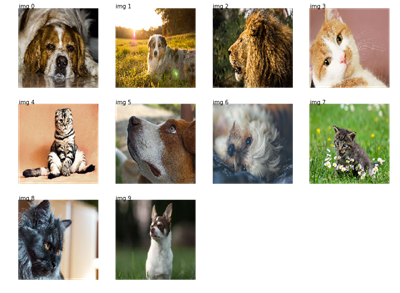
Source: http://www.xavierdupre.fr/app/mlinsights/helpsphinx/notebooks/search_images_keras.html
On making a confusion matrix it looks like below:
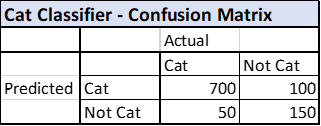
Source: Created by the author
But it does not help understand what is being misclassified, so we isolate the 70 and 80 images respectively, so we look at the images that have been misclassified and create some hypotheses/observations on grouping these errors.
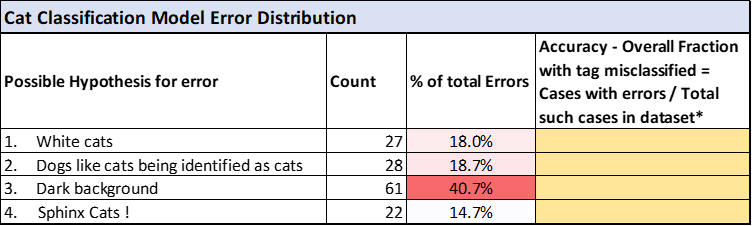
On reviewing all examples quickly, we identify that the following seems to be common across all erroneous cases:
1. White cats not being correctly identified
2. Dogs like cats being identified as cats
3. Dark background leads to misclassification and so on
The hypothesis or commonalities observation for all erroneous use cases is followed by creating a table in Excel or a similar tool to map the exact distribution of the errors. For our cat classification example it looks like below (please note that each data point/image might have more than one of the below tags) :
Source: Created by the author
* for image classification it might be difficult to get this column but can we have done for other use cases like credit approval models
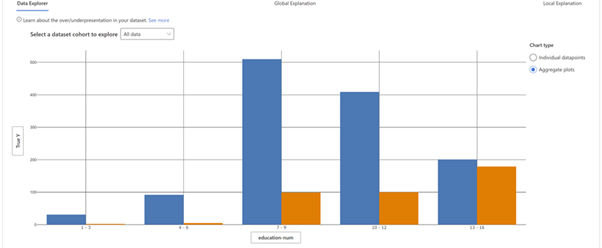
B. Is there a way to do this more automatically? In case the data has more apparent features like a credit rating model, product recommendation model or customer churn model uses cases – a package for quick identification is erroranalysis.ai. It can help identify and further diagnose the error distribution across features and certain values of those features. We can create Heatmaps and TreeMaps to show what is causing the errors and further details on the error specifics.
An example for income prediction on tabular UCI Census Income dataset is given below:
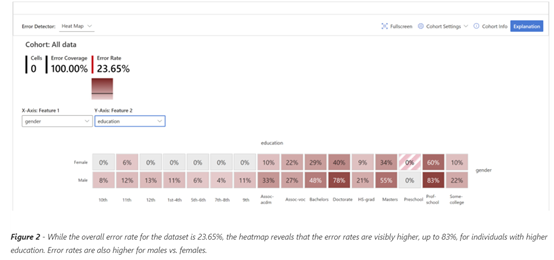
Source: Responsible ML for error analysis
Source: Responsible ML for error analysis
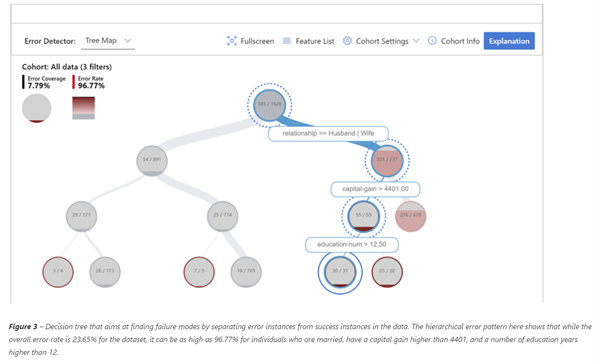
Once the errors have been identified the respective variables can be diagnosed further to get details of the error cohort it is more prevalent in – for this example below is the diagnostics for higher education_num the difference betweenAs all model algorithms rely on creating an as close version of ground truth as possible – Error Analysis and corresponding actions play a key role in accomplishing this. higher income (orange) lower (blue) is different from other group cohorts.
Source: Responsible ML for error analysis
3. Approach and recommendations for error resolution
After identifying and analyzing the errors per above, we need to move to the next step of resolving them!
Let us use a speech recognition example, we populate the similar table mentioned above with additional columns that are the overall % of such cases with error and then the overall % of the dataset that is impacted by the error. It makes sense to choose and start from the hypothesis that would impact the most cases being impacted (also further explained in Andrew Ng’s video).
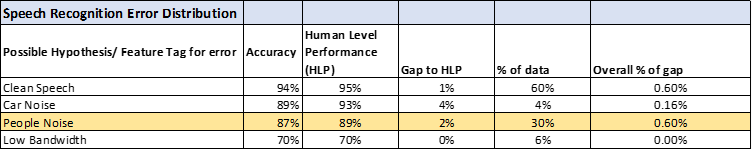
Source: Adapted from https://www.coursera.org/learn/introduction-to-machine-learning-in-production/lecture/6kFkv/prioritizing-what-to-work-on
The above example makes sense to start working on People noise/ Clean Data tag data correction first to have the most impact.
After choosing the area(s) the following can be tried basis feasibility, efforts needed, the importance of improvement in that area, and most accuracy that can be achieved in that area:
1. Collecting more data points for the cases where errors are happening
2. Augmentation of data or steps to improve data quality
3. Use other ML models /tune hyperparameters differently
Frequently Asked Questions
Q1. What are the classification errors?
A. Classification errors refer to instances in machine learning where a model incorrectly assigns a data point to the wrong class or category. These errors can be false positives (misclassifying something as belonging to a class when it doesn’t) or false negatives (failing to classify something correctly). Reducing classification errors is crucial for enhancing model accuracy and performance.
Q2. What are the types of errors in machine learning?
A. There are two types of errors in machine learning models: Reducible Errors and Irreducible Errors.
1. Reducible Errors: These errors are caused by shortcomings in the model itself, such as inadequate feature representation, incorrect assumptions, or suboptimal algorithms. Reducible errors can be minimized through model improvement, fine-tuning, better feature engineering, and refining the learning process.
2. Irreducible Errors: These errors stem from factors that are beyond the control of the model and the data scientists, such as inherent variability in the data or unpredictability in the underlying phenomena being modeled. They represent a limit to how well the model can perform, even with perfect feature representation and algorithm selection. Irreducible errors are challenging to eliminate since they arise from inherent uncertainties in the real world.
While reducible errors can be addressed through model optimization, irreducible errors are a fundamental limitation in the modeling process and cannot be completely eliminated due to the complexity and noise present in real-world data.
Closing thoughts:
Just like model design and testing Error Analysis is an iterative process so it might be worthwhile to spend time and distribute it across the team to conquer it faster.
Article by Ashwini Kumar | Data Science Lead & Crusader | Linkedin
The media shown in this article are not owned by Analytics Vidhya and are used at the Author’s discretion.
Analytics & Data Science Leader | Applies analytics in Retail, Communications & Media domain across marketing, Omni channel sales, operations and people management functions| Helps convert Business Strategy to Data Strategy


