Introduction
One of the biggest challenges for beginners in machine learning / data science is that there is too much to learn simultaneously. Especially so, if you do not know how to code. You need to quickly get used to Linear Algebra, Statistics, other mathematical concepts and learn how to code them! It might end up being a bit overwhelming for the new users.
If you have no background in coding and find it difficult to cope with, you can start learning data science with a tool which is GUI driven. This enables you to focus your efforts on learning the subject in initial days. Once you are comfortable with basic concepts, you can always learn how to code later on.
In today’s article, I will get you started with one such GUI based tool – KNIME. By end of this article, you will be able to predict sales for a retail store without writing a piece of code!
Let’s get started!
Why KNIME?
KNIME is a platform built for powerful analytics on a GUI based workflow. This means, you do not have to know how to code to be able to work using KNIME and derive insights.
You can perform functions ranging from basic I/O to data manipulations, transformations and data mining. It consolidates all the functions of the entire process into a single workflow.
Table of Contents
- Setting up your System
- Creating your first Workflow
- Introducing KNIME
- Importing the data-files
- Visualizations and Analysis
- How do you clean your data?
- Finding missing values
- Imputations
- Training your first model
- Implementing a linear model
- Creating a submission file
- Limitations
1. Setting Up Your System
To begin with KNIME, you first need to install it and set it up on your PC.
Step 1: Go to www.knime.com/downloads

Step 2: Identifying the right version for your PC

Step 3: Install the platform and set the working directory for KNIME to store its files.

This is how your home screen at KNIME would look like.
1.1 Creating your First Workflow
Before we delve more into how KNIME works, let’s define a few key terms to help us in our understanding and then see how to open up a new project in KNIME.
Node: A node is the basic processing point of any data manipulations. It can do a number of actions based on what you choose in your workflow.
Workflow: A workflow is the sequence of steps or actions you take in your platform to accomplish a particular task.
The workflow coach on the left top corner will show you what percentage of the community of KNIME recommends a particular node for usage. The node repository will display all nodes that a particular workflow can have, depending on your needs. You can also go to “Browse Example Workflows” to check out more workflows once you have created your first one. This is the first step towards building a solution to any problem.
To setup a workflow, you can follow these steps.
Step 1: Go to File menu, and click on New.

Step 2: Create a new KNIME Workflow in your platform and name it “Introduction”.
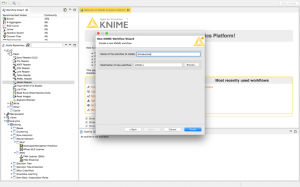
Step 3: Now when you click on Finish, you should have successfully created your first KNIME workflow.

This is your blank Workflow on KNIME. Now, you’re ready to explore and solve any problem by dragging any node from the repository to your workflow.
2. Introducing KNIME
KNIME is a platform that can help us solve any problem that we could possibly think of, in the boundaries of data science today. Topics that range from the most basic visualizations or linear regressions to advanced deep learning, KNIME can do it all.
As a sample use case, the problem we’re looking to solve in this tutorial is the practice problem Big Mart Sales that can be accessed at Datahack.
The problem statement is as follows,
The data scientists at BigMart have collected 2013 sales data for 1559 products across 10 stores in different cities. Also, certain attributes of each product and store have been defined. The aim is to build a predictive model and find out the sales of each product at a particular store.
Using this model, BigMart will try to understand the properties of products and stores which play a key role in increasing sales.
2.1 Importing the data files
Let us start with the first yet a very important step in understanding the problem; importing our data.

Drag and drop the “file reader” node to the workflow and double click on it. Next, browse the file you need to import into your workflow.
In this article, as we will be learning how to solve the practice problem Big Mart Sales, I will import the training dataset from Big Mart Sales.

This is what the preview would look like, once you import the dataset.
Let us visualize some relevant columns and find the correlation between them. Correlation helps us find what columns might be related to each other and have a higher predictive power to help us in our final results.
To create a correlation matrix, we type “Linear Correlation” in the node repository, then drag and drop it to our workflow.

After we drag and drop it like shown, we will connect the output of the file reader to the input of the node “Linear Correlation”.
Click the green button “Execute” on the topmost panel. Now right click the correlation node and select “View: Correlation Matrix” to generate the image below.

This will help you select the features that are important and required for better predictions by hovering over the particular cell.
Next, we will visualize the range and patterns of the dataset to understand it better.
2.2 Visualization and Analysis:
One of the primary things we would like to know from our data would be that what item is sold the maximum out of the others.
There would be two ways to interpret the information:
- Scatterplot

Search for “Scatter Plot” under the Views tab in our node repository. Drag and drop it in a similar fashion to your workflow, and connect the output of File Reader to this node.
Next, configure your node to select how many rows of the data you need and wish to visualize. [I chose 3000]
Click execute, and then View: Scatter Plot.

I have selected the X axis to be Item_Type and the Y axis to be Item_Outlet_Sales.
The plot above represents the sales of each item type individually, and shows us that fruits and vegetables are sold in the highest numbers.
- Pie Chart
To understand an average sales estimate of all product types in our database, we will use a pie chart.

Click on the Pie Chart node under Views and connect it to your File Reader. Choose the columns you need for segregation and choose your preferred aggregation methods, then apply.
This chart shows us that sales were averagely divided over all kinds of products. “Starchy Foods” amassed the highest average sales of 7.7%.
I have used only two types of visuals although you can explore the data in numerous forms while you browse through the “Views” tab. You can use histograms, line plots etc. to better visualize your data.
3. How do you clean your Data?
The other things you can include in your approach before training your model are Data Cleaning and Feature Extraction. Here I will cover an overview of data cleaning steps in KNIME. For further understanding, follow this article on Data Exploration and Feature Engineering.
3.1 Finding Missing Values
Before we impute values, we need to know which ones are missing.
Go to the node repository again, and find the node “Missing Values”. Drag and drop it, and connect the output of our File Reader to the node.

3.2 Imputations
To impute values, select the node Missing Value and click configure. Select the appropriate imputations you want for your data depending on the type of data it is, and “Apply”.

Now when we execute it, our complete dataset with imputed values is ready in the output port of the node “Missing Value”. For my analysis, I have chosen the imputation methods as:
String: Most Frequent Value
Number (Double): Median
Number (Integer): Median
You can choose from a variety of imputation techniques such as:
String:
- Next Value
- Previous Value
- Custom Value
- Remove Row
Number (Double and Integer):
- Mean
- Median
- Previous Value
- Next Value
- Custom Value
- Linear Interpolation
- Moving Average
4. Training your First Model
Let us take a look at how we would build a machine learning model in KNIME.
4.1 Implementing a Linear Model
To start with the basics, we will first train a Linear Model encompassing all the features of the dataset just to understand how to select features and build a model.
Go to your node repository and drag the “Linear Regression Learner” to your workflow. Then connect the clean data that you gathered in the “Output Port” of the “Missing Value” node.

This should be your screen visual as of now. In the configuration tab, exclude the Item_Identifier and select the target variable on top. After you complete this task, you need to import your Test data to run your model.
Drag and drop another file reader to your workflow and select the test data from your system.

As we can see, the Test data contains missing values as well. We will run it through the “Missing Value” node in the same way we did for the Training data.
After we’ve cleaned our Test data as well, we will now introduce a new node “Regression Predictor”.

Load your Model into the predictor by connecting the learner’s output to the predictor’s input. In the predictor’s second input, load your test data. The predictor will automatically adjust the prediction column based on your learner, but you can alter it manually as well.
KNIME has the capability to train some very specialised models as well under the “Analytics” tab. Here is an in-exhaustive list
- Clustering
- Neural Networks
- Ensemble Learners
- Naïve Bayes
5. Submitting your Solution
After you execute your predictor now, the output is almost ready for submission.
Find the node “Column Filter” in your node repository and drag it to your workflow. Connect the output of your predictor to the column filter and configure it to filter out the columns you need. In this case, you need Item_Identifier, Outlet_Identifier and the Prediction of Outlet_Sales.

Execute the “Column Filter” and finally, search for the node “CSV Writer” and document your predictions on your hard drive.

Adjust the path to set it where you want the .csv file stored, and execute this node. Finally, open the .csv file to correct the column names as according to our solution. Compress the .csv file into a .zip file and submit your solution!

This is the final workflow diagram that was obtained.
KNIME workflows are very handy when it comes to portability. They can be sent to your friends or colleagues to build on together, adding to the functionality of your product!
To export a KNIME workflow, you can simply click on File -> Export KNIME Workflow

After that, select the suitable workflow that you need to export and click finish!

This will create a .knwf file that you can send across to anyone and they will be able to access it with one click!
6. Limitations
KNIME being a very powerful open source tool, has its own set of limitations. The primary ones being:
- The visualisations are not as neat and polished as some other open source softwares. (Ex: RStudio)
- Version updates are not supported well, you will have to reinstall the software. (Ex: For updating KNIME from version 2 to version 3, you will need a fresh installation and updating won’t work. )
- The contributing community is not as large as Python or CRAN communities, so it takes a long time for new additions to KNIME.
End Notes
KNIME is a platform that can be used for almost any kind of analysis. In this article, we explored how to visualise a dataset and extract important features from it. Predictive modelling was undertaken as well, using a linear regression predictor to estimate sales for each item accordingly. Finally, we filtered out the required columns and exported it to a .csv file.
Hope this tutorial has helped you uncover aspects of the problem that you might have overlooked before. It is very important to understand the data science pipeline and the steps we take to train a model, and this should surely help you build better predictive models soon. Good luck with your endeavors!


Great going Shantanu. Wish you many successes in the field of data science. Enjoy the journey.
Thank you :)
Hi, I am basically into NAtural language processing and work on Windows. I have a large bi-lingual/paralle data in the format: a=b I am looking for a tool which can use this clean data for training and when given a new file/sample in language a , predict what it could be in language b. This is not necessarily translation but could also be transliteration for example. I have been looking for such a tool since long. Do you know of one ? Mnay thanks for responding
Hi! I believe KNIME can help you with that, as you can either create your own node or run R and Python scripts to preprocess your data. Give it a try.
how can i download this dataset
Hi Akash, The dataset is available here: Big Mart Sales - DataHack