This article was published as a part of the Data Science Blogathon.
Introduction
Community detection in a network identifies and groups the more densely interconnected nodes in a given graph. This graph can take the form of a social network graph, a biological network, or a representation of a local network of computers, for example. Clusters of related nodes can be grouped using various algorithms. In this article, eight such algorithms are tested against three datasets, and their performance is evaluated.
Note: You can access the complete paper I wrote on this topic and the code used here.
Graphs
A graph is a nonlinear data structure that models pairwise relations between objects. A graph comprises nodes or vertices which are connected by edges or links.
An undirected graph consists of symmetric links, whereas a directed graph includes asymmetric, ‘to and from’ links between vertices. Undirected links can be traversed in any direction, whereas directed links can only be traversed in the direction of the link, from the origin to the destination node. A weighted graph is a graph in which links are assigned certain numeric values known as weights. Depending on the graph, these weights may represent costs, lengths, or other quantities.
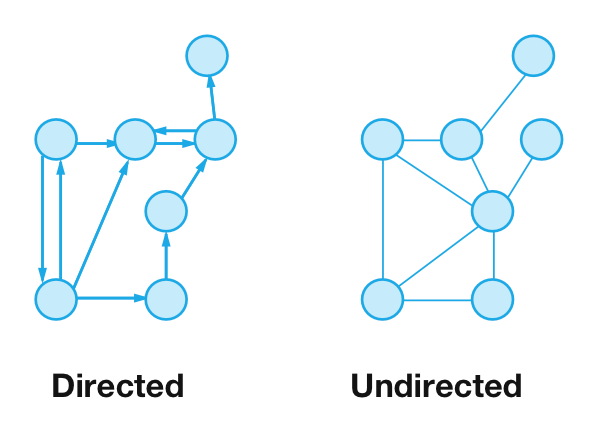
An example of an undirected graph is the roads interconnecting cities that can be traversed in either direction. The relevant directed graph would be airline routes connecting the same fixed in a particular direction.
Graphs can model many types of relations and processes in scientific information systems. Graphs can be used to model and solve many practical problems.
Network Theory and Graphs
Graphs are thus versatile tools to represent various models, and in particular, networks. Network theory studies graphs as a representation of either symmetric or asymmetric relations between discrete objects. A network can be defined as a graph in which nodes and links have attributes like names and where the optional weight attribute represents a real-world
quantity. The analysis of networks lends itself to various scientific fields like biology, physics, statistics, computer science, sociology, and statistics, to derive meaningful inferences from a data store.
Social network analysis, in particular, has emerged as a general application of community detection algorithms. With the rise of the world wide web and social networking sites, characterizing consequent communities yields a wealth of information about human behavioral patterns. Thus, there is a need for algorithms that detect such communities so that further meaningful inferences can be made from them.
Community
A community is defined as a subset of nodes within a graph where the connections or linkages are denser than the rest of the network. A network is said to have a community structure if the nodes of the network can be easily grouped into potentially overlapping sets of nodes, such that
each set of nodes is densely connected internally.
Communities hold significance in a network because they provide insight into its overall entity. Taking the example of a biological application, in metabolic networks, communities correspond to cycles or pathways. In contrast, in protein interaction networks, communities correspond to proteins with similar functionality inside a biological cell.
In social networks, the existence of communities generally affects various processes like false news or epidemic spreading. To completely understand and carry out studies on these processes, community detection techniques are of the utmost
importance.
Community Detection Algorithms
Community detection in a network is the process of identifying and grouping the more densely interconnected nodes in a given graph.
Clustering coefficient as a graph metric
The clustering coefficient of a graph is a measure of the degree to which nodes in a graph tend to cluster together. Evidence suggests that in most real-world
networks, and in particular social networks, nodes tend to create tightly knit communities characterized by a relatively high density of links. This likelihood tends to be greater than the average probability of a link randomly established between two nodes. The clustering coefficient has therefore been used on each network that has been tested in this article as a means of getting an idea about its relative inter-connectivity.
Modularity as a CDA metric
Modularity measures the structure of a given network or graph when community detection is carried out. It measures the strength of the division of a network into modules (communities). Networks with high modularity have dense connections between the nodes within modules but sparse connections between nodes in different modules. The concept of modularity is used to evaluate the partition of a network into communities based on the intuition that random graph structures should not follow a community structure.
LFR benchmark for CDA evaluation
When it comes to detecting communities, there is still no universal agreement on what an ideal result of the community detection process looks like and by extension, the reliability of community detection algorithms. This is where a simple network model, the planted ℓ-partition model, comes into play. In this model, one ‘plants’ a partition in a graph, which consists of a certain number of groups of nodes.
The LFR benchmark is an example of a planted ℓ-partition model. It improves upon the previous GN benchmark by introducing power law distributions of degree and community size. There is also no restriction on the expected degrees or community sizes. LFR benchmark graphs can be generated relatively quickly, even for extensive networks. Thus, it has an advantage over the GN benchmark and is a better test for the performance of any given algorithm. In this article, a network generated by the LFR benchmark has been used to compare the algorithms.
Networks used
The choice of datasets has been made to show the varying impact of the input parameters on the output. A regular real-world network, an artificial network used as a benchmark, and a random graph have been used to test the working of all the algorithms used fairly.
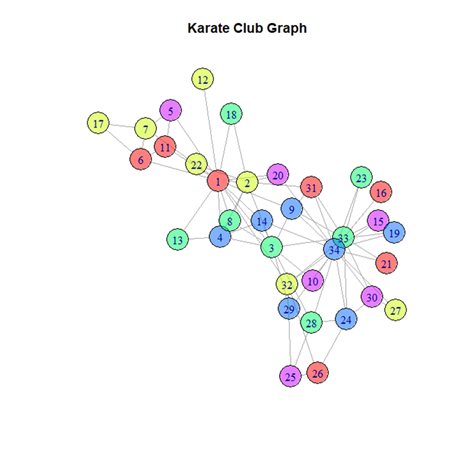
(i) Zachary’s Karate Club network
In 1977 Wayne Zachary collected data about the members of a university karate club. Each node represents a club member, and each edge represents a tie between two members. This is a real-world undirected network with 34 nodes (members) and 78 edges. During this study, a fight arose between members of the club, leading to its splitting into two groups. An interesting problem that thus arose was figuring out these two groups by examining the nature of the links with the aid of community detection algorithms. Thus, this is an apt network to perform
analysis and the results would be notable.
(ii) LFR-generated network
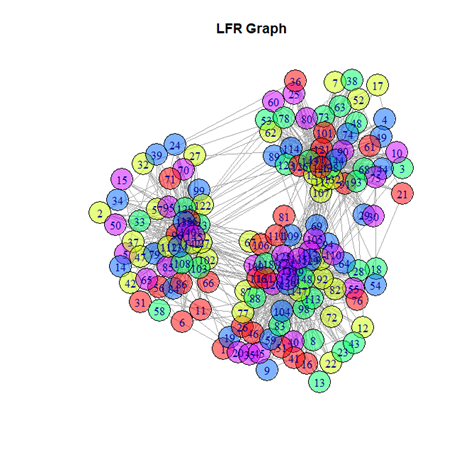
An artificial network with 150 nodes and 1209 edges was generated following the principles of the LFR benchmark. The input was the number of nodes and certain pre-set parameters; the output was the list of edges and nodes of the artificially generated network. The graph is undirected and weighted. This artificial network was specifically generated to test and compare the performances of all the algorithms against each other, hence the name benchmark. It is a useful tool to catch outlier-like behavior of algorithms and identify if they are unreliable compared to alternative ones.
(iii) Random graph
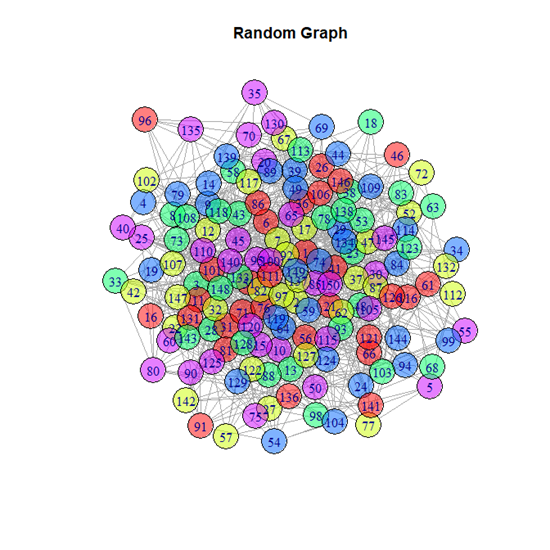
A random undirected graph with 150 nodes and 1000 edges was generated using the igraph package in R. The random network model developed by Erdős-Rényi was used for the same. The testing on random graphs would be a helpful indicator to measure the efficacy of the community detection algorithms. This is because the presence of communities within a random graph should be minimum.
This tendency should be reflected in the output of the algorithms. This is
a step that is often omitted in such analyses of algorithms. A good community detection algorithm should be able to differentiate between a pseudo-community and a community produced by a meaningful network. Hence, this random graph is used to test the eight algorithms used in this article.
Algorithms used
- Girvan-Newman Algorithm
- Label Propagation Algorithm
- Fast Greedy Algorithm
- Spinglass Algorithm
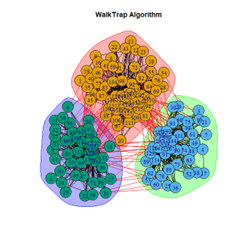
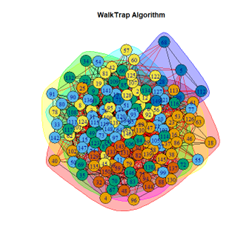
- Walktrap Algorithm
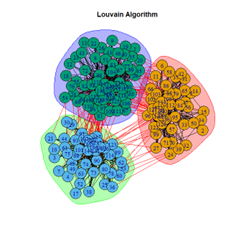
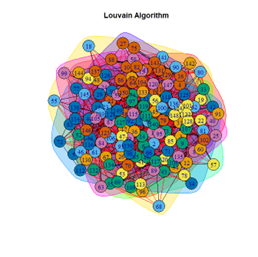
- Louvain Algorithm
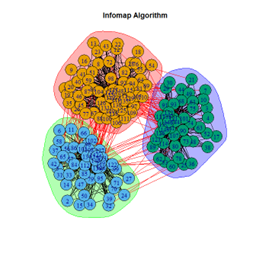
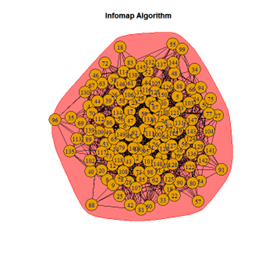
- Infomap Algorithm
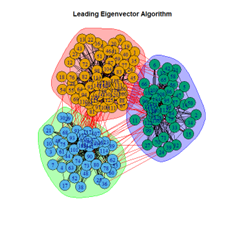
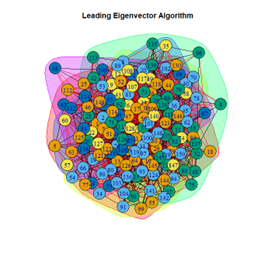
- Leading Eigenvector Algorithm
Each of these algorithms has been tested against the three datasets used.
Implementation:
The visualizations of the networks have been carried out in the R programming language in conjunction with its companion IDE, RStudio. The LFR benchmark network was generated with code in the C++ language authored by its developers, Andrea Lancichinetti and Santo Fortunato.
Code
For loading the graphs into the desired variable, the following code was used:
Zachary network
library(igraph)
net <- graph.famous("Zachary")
pal2 <- rainbow(5, alpha=.5)
#main graph view
plot(net, vertex.color=pal2, main="Karate Club Graph")
Artificial graph
library(igraph)
nodes <- read.csv("nodes.csv", header=T, as.is=T)
links <- read.csv("edges.csv", header=T, as.is=T)
head(nodes)
head(links)
net <- graph_from_data_frame(d=links, vertices=nodes, directed=F)
plot(net, vertex.color=pal2, main="LFR Graph")
Random graph
library(igraph)
net <- erdos.renyi.game(150, 1000, type = "gnm")
plot(net, vertex.color=pal2, main="Random Graph")
The code below plots the community detection algorithm for each graph.
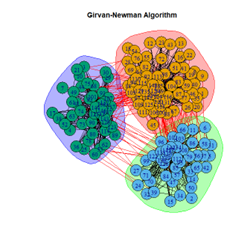
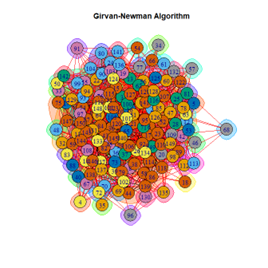
#Girvan Newman
ceb <- cluster_edge_betweenness(net)
#Community plot
plot(ceb, net, main="Girvan-Newman Algorithm")
#modularity
modularity(ceb)
#no
length(ceb)
Results
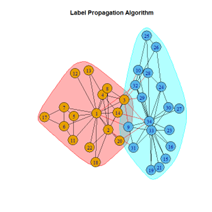
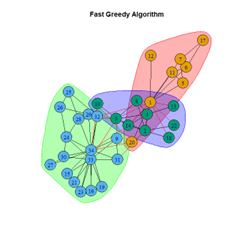
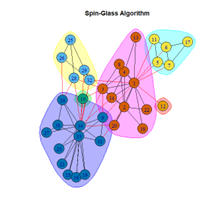
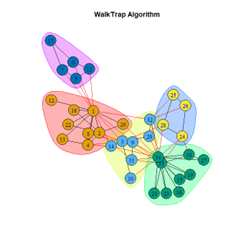
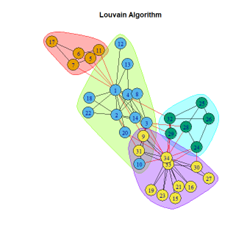
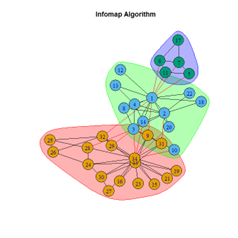
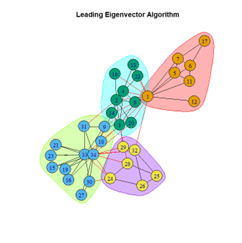
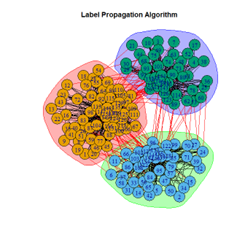
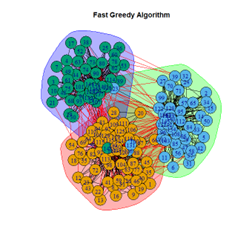
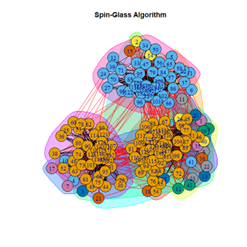
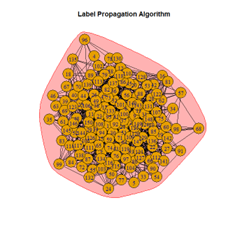
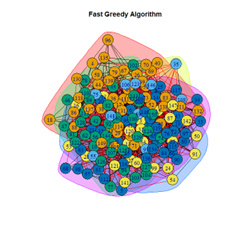
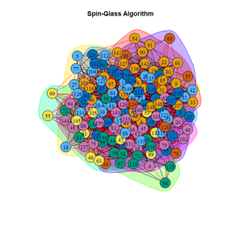
The communities detected on the three datasets by the different algorithms are as follows:
1. Zachary’s Karate Club network
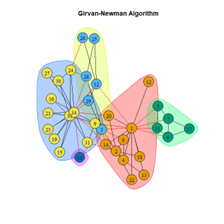
Girvan Newman Algorithm
2. LFR Graph
3. Random Graph
Inferences
Plotting the results of the number of communities yielded and the modularity scores of each algorithm, the inferences that can be made are interesting.
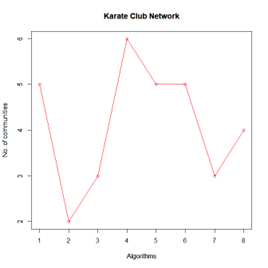
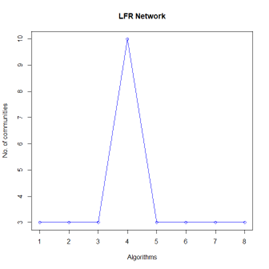
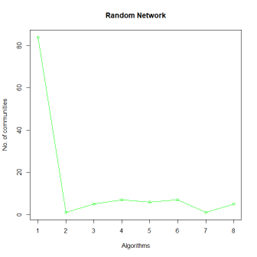
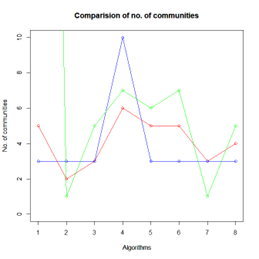
Let the number of communities detected in the Karate Club Network be a reference point. The LFR benchmark performs pretty consistently across most algorithms, as expected. The common result of 3 communities detected is obtained except for the Spinglass algorithm, which detects 10 communities. More communities are detected in the random network than in the other two networks. This may be because of random clusters of densely interconnected nodes in the network that are recognized by the algorithms.
It is seen that Label Propagation and Infomap algorithms fail when it comes to the random network, i.e., they view the entire network as a singleton community rather than detecting discrete sub-communities within it. Consequently, the modularity score is 0 for these two instances. Comparing the modularity scores, the LFR benchmark produces a consistent result. The modularity score of 0.5509484 is obtained for most algorithms, except the Label Propagation and the Spinglass algorithms.
The scores obtained on the LFR benchmark are higher than those on the Karate Club network. The scores of the algorithms with the random network are significantly lower, thus furthering the point that the communities detected on the other networks are meaningful and hold significance. The Spinglass algorithm, however, is an exception to this. Its modularity score on the random network is higher than on the LFR benchmark.
Conclusion
Thus, the following have been implemented, and the performance is as follows:
- Eight community detection algorithms were tested against a real-world, an artificial, and a random network.
- The artificial network is used as a benchmark for the performance of the algorithms. The random network put to the test whether the results of the algorithms are meaningful or not.
- Most algorithms performed consistently against the benchmark, and their performance was lower on the random network as expected.
- The Louvain algorithm performed the best with the most consistent output, whereas the Spinglass algorithm produced outliers and unreliable results.
The media shown in this article is not owned by Analytics Vidhya and is used at the Author’s discretion.
A jack of all trades is a master of none, but oftentimes better than a master of none. Hi there, I'm Tanisha, a data science enthusiast, dabbler of foreign languages and a cat lover. I have a penchant for writing, from short fiction to technical blogs. You can find my work and the places I frequent on the web at https://znap.link/tanishamandal.


